

Abstract
Survanta, a clinically used bovine lung surfactant extract, in contact with surfactant in the subphase, shows a coexistence of discrete monolayer islands of solid phase coexisting with continuous multilayer “reservoirs” of fluid phase adjacent to the air-water interface. Exchange between the monolayer, the multilayer reservoir, and the subphase determines surfactant mechanical properties such as the monolayer collapse pressure and surface viscosity by regulating solid-fluid coexistence. Grazing incidence x-ray diffraction shows that the solid phase domains consist of two-dimensional crystals similar to those formed by mixtures of dipalmitoylphosphatidylcholine and palmitic acid. The condensed domains grow as the surface pressure is increased until they coalesce, trapping protrusions of liquid matrix. At ∼40 mN/m, a plateau exists in the isotherm at which the solid phase fraction increases from ∼60 to 90%, at which the surface viscosity diverges. The viscosity is driven by the percolation of the solid phase domains, which depends on the solid phase area fraction of the monolayer. The high viscosity may lead to high monolayer collapse pressures, help prevent atelectasis, and minimize the flow of lung surfactant out of the alveoli due to surface tension gradients.
INTRODUCTION
Mammalian lung surfactant is a complex mixture of lipids and proteins, the main purpose of which is to reduce the surface tension in the lungs during breathing (Schürch et al., 1976, 1978; Goerke, 1998). Lower surface tensions lead to a greatly reduced work of breathing and greater stability of the alveoli against collapse or overinflation. A deficiency of lung surfactant, common in premature infants, results in neonatal respiratory distress syndrome (NRDS) (Notter, 2000). Early administration of exogenous lung surfactant is an effective treatment for NRDS; however, supplies of human lung surfactant are limited and currently used clinical replacement surfactants are derived from animal sources (Notter, 2000). Survanta is one of the formulations approved by the U. S. Food and Drug Administration to treat respiratory distress syndrome (RDS) and is widely used in U.S. hospitals. Survanta is an organic extract of minced bovine lung supplemented with 1,2-dipalmitoyl-sn-glycero-3-phosphatidylcholine (DPPC), palmitic acid (PA), and tripalmitin (Bernhard et al., 2000). The additional lipids alter certain measures of in vitro surfactant performance, especially the ability to reduce surface tension to near zero on film compression and promote reproducible hysteresis loops on repeated expansion and compression cycles (Notter, 2000).
The latest clinical trials comparing Survanta to Infasurf (calf lung lavage extract) or Curosurf (minced porcine lung extract) show modest differences in neonate mortality or major complications such as bronchopulmonary dysplasia, intraventricular hemorrhage, and necrotizing enterocolitis (Halliday, 1995; Bloom et al., 1997; Clark et al., 2001), despite the fact that the clinically used surfactants vary significantly in both lipid and protein composition (Bernhard et al., 2000). This suggests either that the detailed lipid and protein composition of surfactant is unimportant, or that the currently used clinical surfactants are still far from optimal. Because no replacement surfactant has yet been shown to be comparable to the complete, native surfactant (including all the surfactant proteins), it appears that there still is room for improvement. In vitro, adding SP-B and/or SP-C to Survanta improves the monolayer collapse and respreading behavior (Ding et al., 2001); in vivo, SP-B supplementation of Survanta improves oxygenation and lung compliance in animal models of RDS (Mizuno et al., 1995; Walther et al., 1997, 2000). To provide better answers to the question of optimal surfactant formulation requires a better understanding of how Survanta and other animal extract surfactant films operate at the air-water interface. One way to do this is by relating the roles of the individual lipid and protein species in Survanta to those in simpler model systems. This should provide the understanding necessary to optimize existing animal-extract surfactants as well as to create a purely synthetic replacement surfactant for treatment of NRDS and ARDS.
The generally accepted mechanism by which lung surfactants operate requires that the different lipids and proteins phase separate within the film, and certain components are removed or “squeezed out” as the surface pressure is raised during expiration (Notter, 2000). These components may be lost to the subphase or stored in an associated “reservoir” in the vicinity of the monolayer to facilitate readsorption when the surface pressure is lowered on inspiration (Schürch et al., 1995, 1998; von Nahmen et al., 1997; Ding et al., 2001). Other mechanisms of exchange with the monolayer have been proposed including partial collapse of the fluid phase (Piknova et al., 2002), or exchange with surfactant in solution or exchange with surfactant associated with the interface during the entire breathing cycle (Schürch et al., 1995, 1998; von Nahmen et al., 1997; Takamoto et al., 2001; Zasadzinski et al., 2001; Ding et al., 2003).
A common feature of almost all lung surfactants and model mixtures (Longo et al., 1993; Lipp et al., 1996, 1998; Dluhy et al., 1998; Nag et al., 1998; Discher et al., 1999a,b; Diamant et al., 2000; Ding et al., 2001, 2002a, 2003; Takamoto et al., 2001; Diemel et al., 2002a,b; Piknova et al., 2002; Cruz et al., 2004) is coexistence between a semicrystalline, solid phase (often called liquid condensed (LC) phase in the monolayer literature), and a disordered, fluid phase (often called liquid expanded (LE)) (McConnell, 1991), especially at high surface pressures. Such phase coexistence is important to controlling the surface viscosity and other mechanical properties of the films (Ding et al., 2002a; Alonso and Zasadzinski, 2004), which, in turn, promote high collapse pressures (Diamant et al., 2000; Gopal and Lee, 2001; Lu et al., 2002).
The primary lipid component of Survanta (Bernhard et al., 2000), as is the case for all lung surfactants (Notter, 2000), is saturated dipalmitoylphosphatidylcholine. The fraction of DPPC and other saturated PCs ranges from ∼40% for Infasurf, to ∼60% for Curosurf, to ∼70% for Survanta (Bernhard et al., 2000). From single component and simple lipid mixture phase studies (McConnell, 1991; Bringezu et al., 2001; Lee et al., 2002), solid phases are formed from saturated lipids such as DPPC, as well as saturated fatty acids and fatty alcohols (Bringezu et al., 2001; Lee et al., 2002) and probably tripalmitin. Palmitic acid and DPPC form stable crystalline monolayer phases at lower temperatures than DPPC alone (Bringezu et al., 2001; Ding et al., 2002a; Lee et al., 2002), which increases the fraction of solid phases at a given temperature and surface pressure (Ding et al., 2002a). Survanta is the only animal-derived surfactant that has a significant fraction of free fatty acid and triglycerides (from 10 to 20% by weight relative to DPPC).
Adsorption from the subphase and respreading are generally associated with the fluid phases of surfactant, and hence the unsaturated lipids, although surfactant proteins SP-B and SP-C also play a significant role (Poulain et al., 1996). SP-C is likely involved in maintaining a reservoir of material available for respreading in the vicinity of the interface (von Nahmen et al., 1997; Lipp et al., 1998; Cruz et al., 2000; Ding et al., 2001, 2003; Takamoto et al., 2001). SP-B influences the nature of monolayer collapse, promoting a reversible monolayer folding (Lipp et al., 1998; Ding et al., 2001), alteration of solid-liquid coexistence morphology, and formation of three-dimensional structures in the films (Lipp et al., 1998; Schürch et al., 1998; Perez-Gil, 2002; Ding et al., 2003; Cruz et al., 2004), and is important to the formation of tubular myelin surfactant and adsorption from the subphase (Poulain et al., 1996; Notter, 2000). The surfactant proteins are primarily segregated to the fluid phases of the monolayers, and SP-B is often associated with anionic lipids such as phosphatidylglycerols (Lipp et al., 1998; Cruz et al., 2000, 2004; Ding et al., 2003). The SP-B level in Survanta is ∼10% and the SP-C level is ∼50% of native bovine surfactant (Bernhard et al., 2000). Survanta contains no cholesterol (Bernhard et al., 2000); the quantity, distribution, and function of cholesterol in both native and replacement surfactants is still an open question (Discher et al., 1999a; Orgeig and Daniels, 2001).
AFM images show coexistence of discrete monolayer islands of solid phase coexisting with continuous multilayer “reservoirs” of fluid phase adjacent to the air-water interface immediately after adsorption. This is in contrast to the coexistence of monolayer fluid and solid phases formed by deposition from organic solution. The multilayer reservoirs of fluid phase are present at low surface pressure and appear to result from the adsorption from the surfactant in the subphase (Winsel et al., 2003). The fluid phase multilayer patches are removed from the monolayer at high surface pressures. The condensed domains grow as the surface pressure is increased until they coalesce, trapping protrusions of liquid matrix at the boundaries between the condensed domains. The solid phase remains primarily as a monolayer up to collapse. Subsequent expansion and compression cycles lead to phase coexistence between solid and fluid phases at lower surface pressures, the fraction of solid phase at a given surface pressure increases with the number of expansion and compression cycles.
Grazing incidence x-ray diffraction shows that Survanta separates into at least two phases, one or more of which are two-dimensional crystals. One crystal population is similar to those formed by mixtures of dipalmitoylphosphatidylcholine and palmitic acid (Bringezu et al., 2001; Lee et al., 2002), as expected from the composition of Survanta. On the first compression, at ∼40 mN/m, a plateau exists in the isotherm at which the solid phase fraction increases from ∼60 to 90%. At or just before this plateau, the surface viscosity diverges. As in simple lipid and lipid/protein films (Ding et al., 2002a; Alonso et al., 2004; Alonso and Zasadzinski, 2004), the viscosity is driven by the jamming of the solid phase domains, which depends on the solid phase area fraction of the monolayer. The high viscosity at low surface tension is partly responsible for the high surface pressure at monolayer collapse (Lu et al., 2002), and also likely minimizes atelectasis as well as the loss of lung surfactant from the alveoli due to surface tension gradients (Bangham et al., 1979; Orgeig and Daniels, 2001; Alonso et al., 2004; Alonso and Zasadzinski, 2004). The solid phase lipids promote two important features of a functioning lung surfactant—high surface pressure at collapse and a high surface viscosity. The fluid phase lipids, in combination with the small fractions of SP-B and SP-C, promote adsorption to the interface and formation of reservoirs of fluid phase lipids attached to the film at low surface pressures. Subsequent cycles increase the fraction of solid phase, leading to the viscosity transition occurring at lower surface pressures. Increasing the temperature moves the viscosity transition to higher surface pressures, again consistent with the transition being driven by a minimum solid phase fraction (Ding et al., 2002a).
EXPERIMENTAL
Materials
Survanta is an organic solvent extract of minced bovine lungs produced for clinical use by Ross Laboratories (Columbus, OH). Survanta contains mainly phospholipids and two surfactant specific proteins, SP-B and SP-C (Bernhard et al., 2000). The extract is supplemented with DPPC, PA, and tripalmitin (Tanaka et al., 1986). Like all natural products, the composition varies, but according to the package insert, 1 ml of Survanta contains 25 mg of lipids, of which, 11–15.5 mg/ml are disaturated phosphatidylcholine (mainly DPPC), 0.5–1.75 mg/ml are triglycerides (mainly tripalmitin), and 1.4–3.5 mg/ml are free fatty acids (primarily PA). The primary anionic lipid is phosphatidylglycerol. There is negligible cholesterol in Survanta due to the extraction process. Of the phospholipids, ∼80% is phosphatidylcholine, of which, ∼80% is disaturated (Bernhard et al., 2000). There is <1% (by weight) of surfactant protein, of which ∼1.3 mg/(mmol phospholipid) is SP-B and 16 mg/(mmol phospholipid) is SP-C. The SP-B level is ∼10% and the SP-C level is ∼50% of native bovine surfactant (Bernhard et al., 2000). The hydrophilic proteins SP-A or SP-D (Notter, 2000) are removed from Survanta and all other clinical surfactants. For our experiments, Survanta was diluted in buffer (NaCl 150mM, CaCl2 2mM, NaHCO3 0.2mM, and pH = 7) to a lipid concentration of 1–2 mg/ml and was spread onto the same buffer solution in the Langmuir trough via a syringe. Some material spreads laterally as a drop of solution hits the surface but the film is mainly formed via adsorption of the material from the subphase. Typically, sufficient Survanta was added to raise the surface pressure to ∼10–20 mN/m before compression was initiated.
Methods
Isotherms were recorded with a custom-built Langmuir trough equipped with a Wilhelmy plate and two barriers providing a symmetric compression (Lipp et al., 1997; Ding et al., 2002a,b). The trough had a surface area of 260 cm2, and a typical compression/expansion cycle took 20 min. Certain experiments at higher temperature were done using a ribbon trough with an area of ∼140 cm2 to minimize leakage around the barriers. There was no appreciable difference in the isotherms taken with the different troughs or for cycle times ranging from a minimum of 5 min to a maximum of 40 min. The trough temperature was maintained by circulating water and a thermoelectric device to within ±1°C of the desired temperature.
A p-polarized He-Ne laser was used as the light source for the Brewster angle microscope. A polarizer was placed after the laser to ensure complete polarization. The incident light hits the surface at angle of 53.1° with the vertical, which is the Brewster angle for pure water. At the Brewster angle, the water surface does not reflect any light. Materials, such as surfactants, at the interface invalidate the Brewster condition due to variations in the refractive index caused by variations in the composition or density of the film (Hénon and Meunier, 1991). As only the film reflects the light, the features in the BAM images come from the interfacial film. To improve the contrast on the final images, the reflected light was passed through an analyzer and a diaphragm before being collected with a CCD camera. The magnifier placed after the analyzer allows the adjustment of the horizontal field of view over the range of 420–2800 μm.
For fluorescence imaging, a Nikon Optiphot with the stage removed was positioned above the ribbon trough. A 40× long working distance objective designed for fluorescent light was used for magnification. A dichroic mirror/barrier filter assembly directs the excitation light onto the monolayer (with a normal angle of incidence) and filters the emitted fluorescence. The emitted fluorescence was collected by the objective and detected via a silicon intensified target camera. Images were recorded directly to the computer via an Adaptec frame grabber. Contrast in the images was due to segregation of .5–1 mol% of the fluorescent lipid Texas Red-DHPE (Molecular Probes, Eugene, OR). The fluorescent probe segregates to disordered or fluid phases, which appear bright in images; the probe is absent from the solid or liquid condensed phases, which appear dark (McConnell, 1991).
Grazing incidence x-ray diffraction (GIXD) measurements were performed on a pure water subphase at 20°C using the liquid surface diffractometer on the beam line BW1 at HASYLAB, DESY (Hamburg, Germany). The synchrotron beam was made monochromatic by a beryllium (002) crystal (λ = 1.304 Å). Experiments were performed at an angle of incidence of 0.85 αc (αc is the critical angle for total external reflection), which maximizes sensitivity for the surface and reduces background scattering from the subphase. The dimension of the footprint is 2 × 50 mm. To suppress capillary waves, a borosilicate glass block was inserted underneath the footprint area limiting the water depth to ∼300 μm. The diffracted signal was recorded along the vertical scattering vector component Qz = (2π/λ) sinαf, where αf is the vertical exit angle, using a linear position sensitive detector (OED-100-M, Braun, Garching, Germany). The measurements were performed by scanning over a range along the horizontal scattering vector component Qxy ∼ (4π/λ) sin θxy, where 2θxy is the horizontal diffraction angle. The horizontal resolution of 0.008 Å−1 was determined by a Soller collimator mounted in front of the position sensitive detector. The vertical acceptance of the detector was 0 < Qz < 1.27 Å−1. The analysis of the in-plane diffraction data results in Qxy- peak positions, which yield d-spacings  that can be indexed by two Miller indices (hk) to describe the unit cell. From the peak positions of the in-plane and the out-of-plane scattering vector components it is possible to derive information about the tilt angle and the tilt direction. Assuming an exponential decay of the correlation as known from liquid crystals, it is possible to derive information about the coherence length, ξxy = 2/ΔQxy from the full width at half maximum of the horizontal vector component (ΔQxy) after correction for the instrumental resolution (Helm et al., 1987). Detailed reviews of the principles of GIXD for the study of two-dimensional crystalline films at the air-liquid interface are available in the literature (Als-Nielsen and Möhwald, 1991; Als-Nielsen et al., 1994; Kaganer et al., 1999).
Samples for atomic force microscope (AFM) imaging were prepared using classical Langmuir-Blodgett deposition (Zasadzinski et al., 1994). Mica substrates, cleaved with adhesive tape immediately before use, were put into the subphase and held by tweezers perpendicular to the interface. Survanta was spread as described earlier and the barriers were compressed to the correct surface pressure. The substrate was pulled through the interface while the surface pressure was held constant via the motion of the computer-controlled barriers. At the plateau in the isotherm, where the change in area with change in surface pressure was large (Fig. 1), the pressure control feedback was difficult so films could not be prepared. The film-covered mica surfaces were transferred to a modified Nanoscope III AFM (Digital Instruments, Santa Barbara, CA) for imaging under ambient conditions. AFM imaging was done with a 150- × 150-μm (J) scanner in contact mode in air at ambient temperature. Silicon nitride tips with a spring constant of 0.12 N/m were used. Under the deposition and imaging conditions used here, the hydrophobic or air side of the film is facing outward from the mica and is the surface being imaged (Zasadzinski et al., 1994).
FIGURE 1.

Surface pressure-trough area (π-A) isotherms of Survanta adsorbed from saline suspension onto a saline buffer at 25°C. The first compression-expansion cycle is labeled 1. Consecutive compression-expansion cycles are labeled 2–4. The lower surface pressure at the beginning of the second cycle suggests that material is lost during the first compression. Dashed lines identify several zones common to all isotherms. Zone A is a homogeneous LE phase at low surface pressure. Zone B corresponds to phase coexistence between an LC phase and the LE phase (see Figs. 2–4). Zone C shows the squeeze-out plateau, starting at ∼38 mN/m, which accompanies the removal of the LE phases from the film, which leads to a less compressible condensed phase (zone D). At E, the film collapses; after the first cycle, the high surface pressure zones are reproducible, suggesting a minimal loss of solid phase.
The limiting velocity of a needle dragged from one side of the Langmuir trough to the other by a constant magnetic force was measured to determine the average interfacial shear viscosity, η (Ding et al., 2002a,b; Alonso and Zasadzinski, 2004). To achieve a constant force on the needle (Fm), the trough was positioned off-center between two Helmholtz coils to provide a homogenous magnetic field gradient over the whole trough (Ding et al., 2002a,b; Alonso and Zasadzinski, 2004). A channel (14-mm wide) formed by two glass plates along the axis of the magnetic gradient provided guidance and simple boundary conditions to a magnetic needle floating at the air-water interface (a hollow Teflon rod 3-cm long and 2-mm diameter containing a small, cylindrical permanent magnet). The magnitude of Fm was adjusted by varying the current in the coils via two power supplies. Above the channel, a video camera recorded the needle motion, the video signal was digitized, and the needle speed derived from these images. The needle motion follows an exponential law for which the steady-state value is Fm/C, in which C is the drag coefficient of the film and the subphase. C minus the drag exerted by the bare subphase (0.042 mN-s/m) was proportional to the two-dimensional shear viscosity η of the film (Alonso and Zasadzinski, 2004). The apparatus was calibrated against DPPC monolayers of known viscosity (Sacchetti et al., 1993; Ding et al., 2002a,b; Alonso and Zasadzinski, 2004). Measurements were taken at constant temperature while holding the surface pressure at a constant, fixed value. The density of the magnetic needle is greater than that of the subphase; the needle is kept floating partly by surface tension. However, for surface pressures >∼45 mN/m, the needle sinks into the subphase (Alonso and Zasadzinski, 2004), limiting the range of viscosity measurements.
RESULTS AND DISCUSSION
Isotherms
Typical surface pressure-trough area (π-A) isotherms for Survanta films spread from saline solution onto saline buffer at 25°C are shown in Fig. 1. The x axis is labeled as % trough area, as the absolute amount of Survanta that adsorbs to the interface is not fixed. Four consecutive compression-expansion cycles are shown, labeled from 1 to 4. All cycles present the same features; however, the first cycle, just after adding the surfactant, is offset to higher areas than subsequent cycles. A larger amount of material is lost to the subphase between the two first cycles as compared to later cycles (see Figs. 2 and 3). During the first compression, excess material is removed from the interface. However, as this Survanta film was formed via adsorption from the subphase, the first compression could also be a composition-refining process; that is, the excess material expelled from the interface may not have the same composition as what is left behind. In Fig. 1, dashed lines are plotted with the isotherms to distinguish five zones, labeled A–E, singled out by their slope.
FIGURE 2.
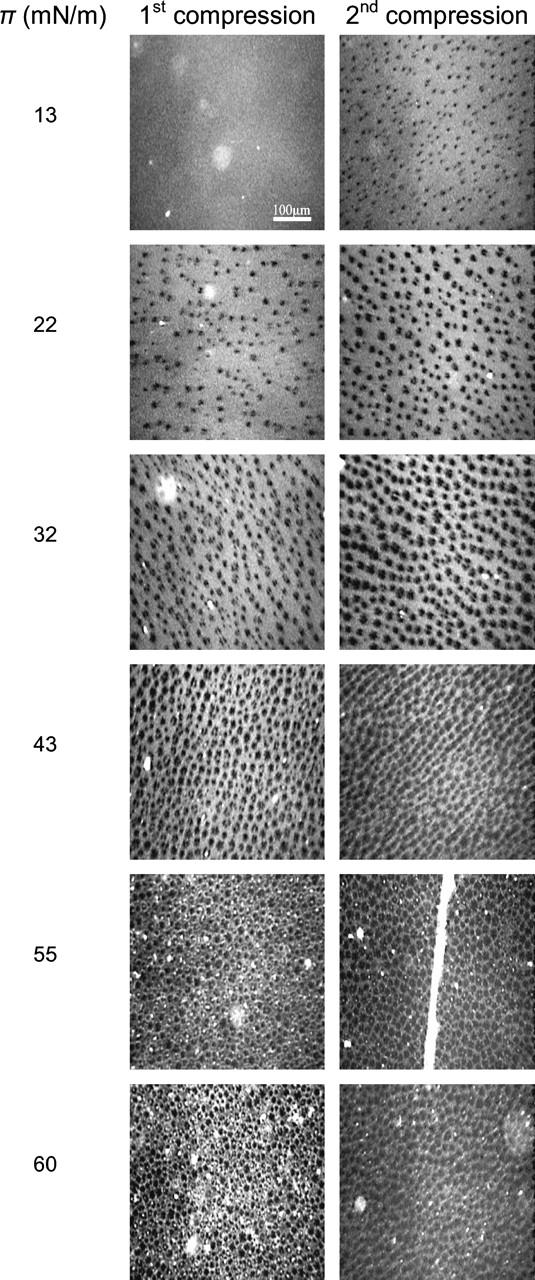
Fluorescence microscopy images of Survanta films spread on saline buffer at 37°C during the first (column 1) and second compression (column 2) of the films. The fluorescent lipid Texas Red-DHPE (0.5–1 mol%) (Molecular Probes) was added to provide contrast in the images. The solid phase (see Fig. 3 and Table 1) appears dark and the liquid phase is bright. The surface pressure (π) is given to the left. On the first compression, the film is in the liquid expanded phase at low surface pressures (13 mN/m). Increasing the surface pressure leads to a steady increase in the fraction of solid phase domains; the fluid phase remains continuous up to the plateau pressure. At 55 mN/m, above the plateau pressure, the number of bright, white spots increases, suggesting a loss of fluid phase material to the subphase. On the second compression, the film has changed sufficiently in composition that the solid phase domains start to nucleate by 13 mN/m (column 2). At every surface pressure, the fraction of solid phase is higher, consistent with the shift of the isotherms toward smaller areas in Fig. 1. The collapse of the film occurs through the formation of bright cracks, one of which is visible in the image at 55 mN/m. At high surface pressure, there is less evidence of bright spots in the image, consistent with less fluid phase being available.
FIGURE 3.
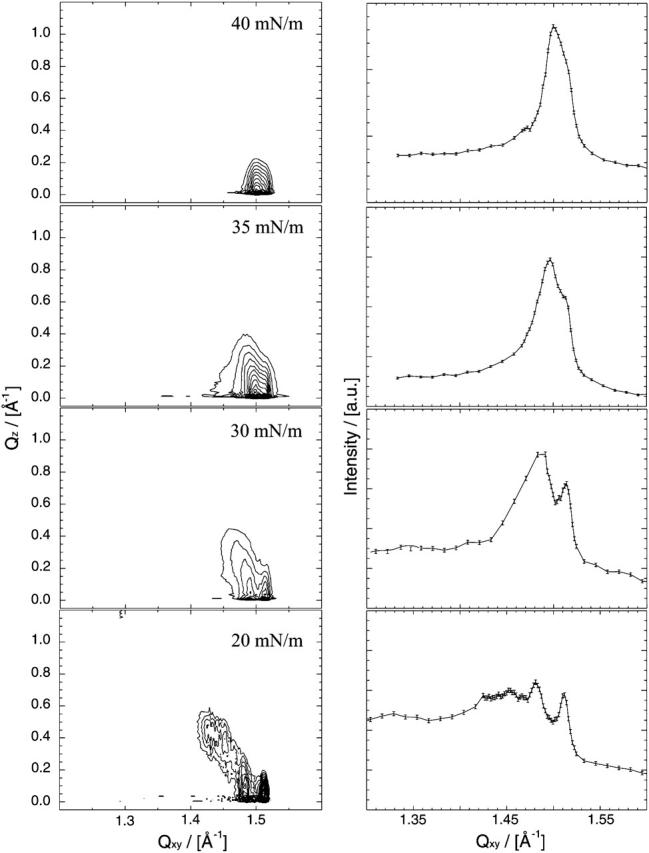
Contour plots (column 1) of the corrected x-ray intensities versus in-plane and out-of-plane scattering vector components Qxy and Qz for Survanta on water at 20°C. The corresponding Bragg peaks as function of Qxy are shown in column 2. The Bragg peaks were obtained by summarizing the measured x-ray intensities over Qz between 0 < Qz < 0.5 Å−1. From bottom to top the plots show the results obtained at 20, 30, 35, and 40 mN/m, respectively. At 20 mN/m, the contour plots show a significant intensity for Qz > 0, indicating a tilted phase. By 40 mN/m, the contour has moved to Qz = 0, indicating that the films are untitled. This shows that the solid phase is not pure DPPC, which remains tilted at 40 mN/m. The lattice parameters and phases are assigned in Table 1.
In zone A, below ∼10 mN/m, the slope of the isotherm is small, signifying a film of high compressibility, typical of liquid-expanded phases (McConnell, 1991). The slope increases in zone B, between 10 and 40 mN/m, denoting a less compressible film. At 25°C, pure DPPC monolayers undergo a liquid expanded to liquid condensed phase transition at ∼12 mN/m, close to the onset of the transition between zones A and B. The decrease in compressibility is due to the formation of condensed domains of DPPC cocrystallizing with PA or tripalmitin (Bringezu et al., 2001; Lee et al., 2002), coexisting with LE phase (see Figs. 2–4). The phase behavior of monolayers of DPPC/POPG/PA lipid mixtures support this hypothesis (Bringezu et al., 2001; Diemel et al., 2002b; Ding et al., 2002a). A plateau appears at π ∼ 38 mN/m (zone C) consistent with the partial removal or “squeeze-out” of the fluid phase (Takamoto et al., 2001; Diemel et al., 2002b; Piknova et al., 2002). Unsaturated lipids are generally unable to sustain high surface pressures, and are pushed out of the interface toward a reservoir of material located underneath the film (see Figs. 2–4) (Schürch et al., 1995, 1998; Ding et al., 2001). Zone D corresponds to a less compressible film than in zone B, illustrating the enrichment in saturated lipids and fatty acids that form the most condensed phases in monolayers (Bringezu et al., 2001; Lee et al., 2002). The collapse of the film (zone E) occurs at π = 66 mN/m, (an equivalent surface tension of ∼6 mN/m). Upon expansion there is a large hysteresis manifested by a rapid drop in surface pressure to 20 mN/m at almost constant area on the initial expansion. The rate of surface pressure decrease changes abruptly below 20 mN/m as material is adsorbed or reincorporated into the film (Warriner et al., 2002). The surface pressure at full trough expansion drops to a value lower than the starting point of the cycle, indicating a net loss of material from the interface. Subsequent cycles are more similar to one another than to the first, but all are displaced toward smaller trough areas. At surface pressures >40 mN/m, the cycles closely superimpose. At higher surface pressures, the film is enriched in solid phases (see Fig. 2); this shows that DPPC and PA (and likely the tripalmitin) are retained in the film after collapse and subsequent cycling. Fig. 1 shows that Survanta lowers surface tension and respreads well after collapse, two essential requirements for a lung-surfactant replacement. The shape of the isotherms does not change significantly with temperature up to 37°C, except that the plateau pressure increases slightly with increasing temperature: 38 mN/m at 25°C, 40 mN/m at 30°C, and 42 mN/m at 37°C.
FIGURE 4.
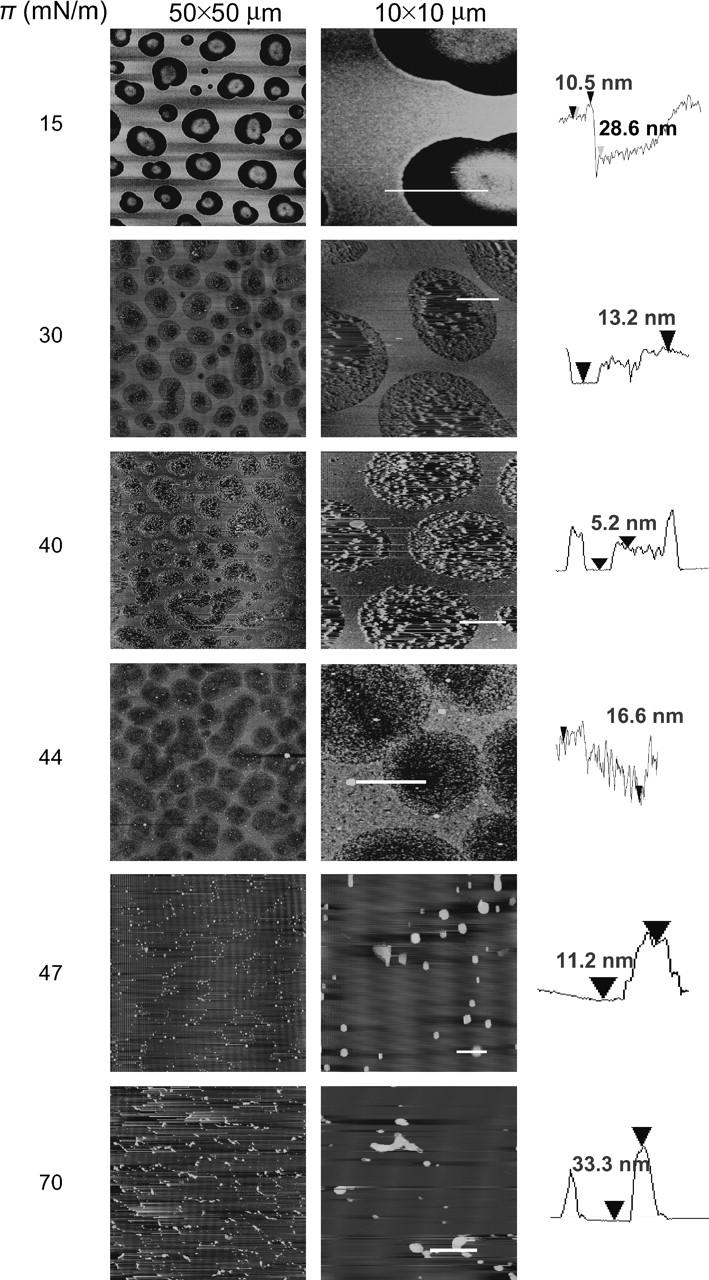
Atomic force microscopy images of Survanta transferred onto mica substrates by conventional Langmuir-Blodgett deposition at the surface pressure given at the left of each image. The low-resolution images are 25 × 25 μm, and the high-resolution images are 2.5- × 2.5-μm sections taken from the low-resolution images. The height trace in the third column corresponds to the white line on each high-resolution image. The brightness in the image increases with the height relative to the mica substrate. At 15 mN/m, the film consists of a continuous fluid phase separating circular domains of solid phase, consistent with the fluorescence images in Fig. 2. The fluid phase is ∼30 nm thicker than the solid phase domains, suggesting the adsorption of multilayers of lipid onto the fluid phase. At 30 mN/m, the morphology is similar, but the height difference has decreased and the solid domains appear less homogeneous and much rougher. As in the fluorescence images, the fraction of solid phase domains increases with increasing surface pressure. At 40 mN/m, the height difference between the solid and fluid domains decreases and the solid domains are packed closer together, although the fluid phase is still continuous. From 44–47 mN/m, the solid phase domains coalesce and the fluid phase is removed. At 44 mN/m, the solid and fluid phase both start to roughen, and the solid domains are no longer uniform circles; they appear to fuse to form more oblong structures. By 47 mN/m (see Fig. 7), most of the fluid phase has been removed; only small patches remain between the solid phase domains. Further compression to 70 mN/m does not change the monolayer significantly.
Fluorescence optical microscopy
The first column in Fig. 2 shows fluorescence images of Survanta at 37°C on the first compression cycle. Discrete dark domains coexist in a continuous bright background similar to model lipid and lipid protein mixtures (Lipp et al., 1998; Nag et al., 1998, 2002; Ding et al., 2001, 2002a; Gopal and Lee, 2001; Takamoto et al., 2001; Diemel et al., 2002b; Piknova et al., 2002). As the surface pressure is increased, the fraction of dark domains increases, although the bright phase remains continuous up to ∼43 mN/m. The domains are fairly monodisperse and the shapes are circular to elliptical. In model lipid systems, the dark domains are assumed to be crystalline phases that exclude the bulky fluorophore that cannot pack into a crystalline lattice (McConnell, 1991). On the second compression of the film (Fig. 2, column 2), the film morphology is the same, but there is a higher fraction of dark domains at a given surface pressure. This is consistent with the shift in the isotherms in Fig. 1 toward smaller areas at low surface pressure and is suggestive of selective removal of the unsaturated lipids, possibly facilitated by SP-B or C (von Nahmen et al., 1997; Lipp et al., 1998; Ding et al., 2001, 2003). However, in this more complex natural lipid system, it could be possible that the phase coexistence is between two liquid phases that have differential solubility for the dye, as is observed in certain cholesterol-phospholipid mixtures (Keller et al., 2000; Veatch and Keller, 2003).
Grazing incidence x-ray diffraction
GIXD is sensitive only to phases with crystalline order. Fig. 3 shows contour plots of the corrected x-ray diffraction intensities as a function of the in-plane scattering vector components Qxy and the out-of-plane scattering vector component Qz at lateral pressures of 20, 30, 35, and 40 mN/m. Starting in zone B of the isotherm, the diffraction pattern shows Bragg peaks, confirming that the dark domains in Fig. 2 have crystalline order. Considering the composition of Survanta, these domains are likely formed of DPPC and PA (Bringezu et al., 2001; Lee et al., 2002) and tripalmitin or DPPC plus tripalmitin, the three saturated lipid species known to crystallize at the air-water interface. The lattice parameters are given in Table 1. At 20 mN/m, four diffraction peaks at 1.428 Å−1, 1.454 Å−1, 1.482 Å−1, and 1.509 Å−1 can be extracted from the data. The analysis yields a Bragg rod maximum at Qz = 0 Å−1 for the peak at highest Qxy value. All other reflections occur at Qz positions above zero (0.11, 0.35, 0.45Å−1), indicating tilt. As the surface pressure increases to 30 mN/m, the two reflections at lowest Qxy merge. The two reflections at 1.513 Å−1 and 1.489 Å−1 are located at Qz = 0 Å−1, and the third reflection at 1.475 Å−1 exhibits a Bragg rod maximum at 0.25 Å−1. At the highest pressure investigated (π = 40 mN/m) only two reflections at 1.515 and 1.501 Å−1 could be resolved, both having their Bragg rod maximum at Qz = 0. The two distinct peaks at the highest surface pressure suggest that there are two distinct crystal lattices in the film at all surface pressures. Survanta is a complex mixture of bovine extract surfactants enriched with saturated DPPC, PA, and tripalmitin. These saturated lipids are known to form condensed phases at the air-water interface by themselves (Helm et al., 1987; Brezesinski et al., 1995; Teer et al., 2000; Lee et al., 2002) and in mixtures with each other and with unsaturated lipids (Bringezu et al., 2001). At low surface pressure, PA packs into a centered rectangular lattice with tilted chains in direction toward nearest neighbor (NN). With increasing pressure, a phase transition due to a change of the tilt direction from NN toward next nearest neighbor (NNN) occurs, before a second phase transition leads to an upright orientation of the molecules (Teer et al., 2000) at ∼22 mN/m. However, pure PA monolayers collapse at surface pressures <40 mN/m, so the reflections seen in Fig. 3 are not from pure PA crystals. Pure DPPC monolayers exhibit an oblique lattice that is only slightly distorted from centered rectangular symmetry. In this case, mismatch of the space requirements between the bulky hydrated PC headgroup and the two chains is compensated by a large tilt of the chains of 27° (π = 30 mN/m). Even at 45 mN/m, the chains are tilted (Brezesinski et al., 1995). However, incorporation of alkanes (Thoma and Möhwald, 1995; Brezesinski et al., 1996), fatty acids, or fatty alcohols (Bringezu et al., 2001; Lee et al., 2002) into the distorted chain lattice reduces the mismatch between head and tail, leading to decreased tilt angles and more stable crystals.
TABLE 1.
Lattice parameters (a,b,γ), chain tilt (t), area per chain perpendicular to the chain long axis (A0), and the projected area per chain (Axy) at the water surface of two distinct crystal phases observed in Survanta films
| π/[mN/m] | a/[Å] | b/[Å] | γ/[°] | t/[°] | Axy/[Å2] | A0/[Å2] |
|---|---|---|---|---|---|---|
| Phase I: DPPC-PA phase | ||||||
| 20 | 4.90 | 4.99 | 118.1 | 18.6 | 21.6 | 20.4 |
| 30 | 4.93 | 4.89 | 120.3 | 11.1 | 20.8 | 20.4 |
| 35 | 4.89 | 4.85 | 120.1 | 8.4 | 20.5 | 20.2 |
| 40 | 4.83 | 4.83 | 120.0 | 0 | 20.2 | 20.2 |
| Phase II: other solid phase | ||||||
| 20 | 4.81 | 4.81 | 120.0 | 0 | 20.0 | 20.0 |
| 30 | 4.79 | 4.79 | 120.0 | 0 | 19.9 | 19.9 |
| 35 | 4.79 | 4.79 | 120.0 | 0 | 19.9 | 19.9 |
| 40 | 4.79 | 4.79 | 120.0 | 0 | 19.9 | 19.9 |
The values are calculated from peak positions of the in-plane scattering vector component Qxy and the out-of-plane component Qz of the diffraction signal that are obtained from peak fits using a Lorentzian model for Qxy and a Gaussian model for Qz. Phase I is very similar to a 1:1 (mol/mol) DPPC/PA cocrystal; the DPPC/PA also exhibits a tilted, oblique lattice at low surface pressure and an untilted hexagonal packing at high surface pressure (Lee et al., 2002). Phase II is hexagonal and untilted over the entire range of surface pressure and may be due to the tripalmitin in Survanta.
The diffraction patterns observed for Survanta suggest a demixing of the condensed phases into a phase with lattice spacing and tilt very similar to that of 1:1 (mol/mol) DPPC:PA (phase I) and a second, somewhat more condensed phase, which likely contains the remaining DPPC and the tripalmitin (phase II). The three reflections at 1.428 Å−1, 1.454 Å−1, and 1.482 Å−1 are assigned to the low order (10), (01), and (11) reflections of phase I at 20 mN/m, corresponding to a lattice with aligned chains tilted in nonsymmetry direction (oblique). For such intermediate tilt azimuth, the relation between the Bragg rod maxima is Qz1 = Qz2 + Qz3 with Qz1 being the peak with the largest Qz value (Kaganer et al., 1999). Here, Qz1 = 0.45 Å−1, Qz2 = 0.35 Å−1, and Qz3 = 0.11 Å−1, which satisfies Qz1 = Qz2 + Qz3 and suggests that the three reflections come from the same lattice. From the peak positions, a tilt of 19° is calculated for phase I at 20 mN/m with a projected area per chain, Axy, of 21.5 Å2 and the chain area perpendicular to the chain, A0, of 20.4 Å2. The lattice spacings, tilt, projected area per chain, and area per chain are similar to that of a 1:1 (mol/mol) DPPC/PA cocrystal (Bringezu et al., 2001; Lee et al., 2002). With increasing pressure, the Bragg peak positions of the tilted phase shift to larger values, consistent with the DPPC/PA cocrystal. At 30 mN/m, the titled phase exhibits two reflections, the degenerate  and the nondegenerate (02) reflections of a centered rectangular lattice with NN titled chains and a tilt of 11°. At 35 mN/m, this rectangular phase shows a decreased tilt angle of 8.4°. At 40 mN/m, the two reflections merge, and both exhibit their Qz maxima on the horizon, indicating untilted chains. As is the case for 1:1 DPPC/PA at 40 mN/m, the lattice is hexagonal and the molecules are untilted with Axy = 20.2 Å2 (Lee et al., 2002).
The remaining peak, at 1.509 Å−1 at 20 mN/m, which moves to 1.515 Å−1 at 40 mN/m, is assigned to a second, untilted hexagonal phase. At 20 mN/m, the hexagonal lattice parameter is 4.81 Å and the area perpendicular to the chains Axy = A0 = 20.0 Å2. The lattice remains hexagonal and untilted as the surface pressure increases, and the lattice parameters slightly decrease to 4.79 Å and Axy = A0 = 19.9 Å2. This second phase might be the tripalmitin and any remaining DPPC, however, there are no established values of mixed tripalmitin/DPPC films available in the literature. There does not appear to be any pure DPPC crystals in the film as there are no nonzero Qz components at this surface pressure, and pure DPPC crystals remain tilted at 40 mN/m. However, the diffraction clearly shows phase separation into one or more crystalline phases of the saturated lipids. Thus, the interfacial film consists of crystalline condensed domains coexisting with a disordered fluid phase, as is the case for simple lipid mixtures containing DPPC and PA (Bringezu et al., 2001).
Atomic force microscopy
To obtain higher-resolution images of the film and a quantitative estimation of the range of domain sizes and thicknesses, Survanta films were imaged by AFM after Langmuir-Blodgett deposition at various surface pressures. During the transfer, material located near the air-water interface can be trapped between the mica substrate and the interfacial film; therefore, AFM can also reveal the three-dimensional structure of the monolayer and the associated reservoir material. Although this complicates interpretation, AFM is the only tool that can map the three-dimensional film morphology, as many of the features seen in AFM are below the resolution of optical imaging techniques.
Representative AFM images at various stages of the first compression are shown in Fig. 4. The low-resolution image at low surface pressure (15 mN/m) shows a bright network along with discrete, dark circular and elliptical domains, similar to the fluorescence images in Fig. 2. In AFM images, bright means higher or thicker, and dark means thinner, as is quantified in the height traces in the third column. At 15 mN/m, the bright network is relatively smooth and is ∼15 nm higher than the circular domains. From the correspondence between the fluorescence and AFM images, the bright, continuous phases are likely fluid, whereas the discrete dark domains in both FM and AFM images are solid phase, as shown by the GIXD results. The much greater thickness of the fluid phase is likely due to material underneath the monolayer trapped during LB deposition. The thick fluid domains of the films formed by adsorption are quite different from AFM images of lipid or lipid/protein films spread from solvent, in which the entire film is a single monolayer at low surface pressure (Zasadzinski et al., 1994; von Nahmen et al., 1997; Lipp et al., 1998; Ding et al., 2001, 2003; Takamoto et al., 2001; Cruz et al., 2004). Adsorption likely occurs via the fluid phase and the multiple layers are associated with spreading from a multibilayer surfactant aggregate. This morphology is similar to films containing fluid phase lipids and SP-C that form multilayer patches in the fluid phase, but only at high surface pressure (von Nahmen et al., 1997; Ding et al., 2001; Takamoto et al., 2001). Most of the protein is located in the fluid phase, so if the proteins are involved in adsorption or stabilization of multilayer reservoirs (Schürch et al., 1995, 1998; von Nahmen et al., 1997; Ding et al., 2001; Takamoto et al., 2001), it is reasonable for the fluid phase to be the most likely location for adsorption. Quantitative Brewster angle microscopy has also shown 12-nm-thick films adsorbing at the air-water interface from lavage fluids deposited in the subphase (Winsel et al., 2003).
At 15 mN/m, the solid domains exhibit a hemispherical mound in the center of the domains. The measured thickness variations of >30 nm across the image demonstrates that even at low pressure, the film is not a simple monolayer, but rather a monolayer with an underlying reservoir of multilayers (Schürch et al., 1995, 1998; von Nahmen et al., 1997; Ding et al., 2001, 2003; Winsel et al., 2003).
At 30 mN/m, the images show isolated solid domains surrounded by a fluid matrix, which is ∼13 nm higher than the condensed phase and is still smooth. By comparison with the lower pressure image, this indicates a thinning and likely loss of reservoir material. The centers of the solid domains lose reservoir material and the hemispherical mounds on the solid phase domains dissipate. If a 5-min waiting period is imposed before film transfer, the solid domains completely lose the reservoir material (image not shown).
The corresponding low-resolution image (50 × 50 μm) shows the close correspondence between the AFM images and the fluorescence images (Fig. 2). As in the fluorescence images, the area fraction of the solid phase domains increases with increasing surface pressure. As the surface pressure increases to ∼40 mN/m, at the start of the plateau in the isotherm (Fig. 1, zone C), the morphology of circular solid domains in a continuous fluid phase matrix remains. The variation in height across the film decreases to ∼5 nm. As the surface pressure is increased to 44 mN/m, the fluid phase roughens and is again ∼16 nm higher than the center of the condensed areas. The condensed areas are rough as well and start to coalesce. For all films transferred at surface pressures corresponding to the plateau region in the isotherm (Fig. 1), distinct areas of solid and liquid are seen, but neither region is smooth. By the end of the plateau at 47 mN/m, no discrete solid domains are left. The film is flat with some small protrusions and is likely now a single monolayer. In the low-resolution image, the protrusions appear to trace out shapes similar to those of the solid phase domains at lower surface pressures. The film appears to be almost completely solid with only isolated patches of the reservoir material. The small protrusions are likely remnants of the fluid material that was ejected, possibly stabilized by SP-B (Lipp et al., 1998; Ding et al., 2001, 2003) or SP-C (von Nahmen et al., 1997; Takamoto et al., 2001). In earlier work, adding SP-B to Survanta helped to keep the fluid phase continuous, separating the solid phase domains at high surface pressures (Ding et al., 2001). At collapse at 70 mN/m, few bright spots remain, again apparently lining the boundaries between the compressed solid domains.
Fig. 5 helps quantify the morphological changes happening within the film at the plateau. The AFM images were digitally thresholded to enhance the contrast between liquid and condensed phases to more accurately quantify the condensed area fraction of the film. Below the plateau, the interfacial film is composed of circular condensed phase domains in a fluid matrix. As the surface pressure increases, the average diameter of the domains increases. By the end of the plateau, the domains coalesce, and the fluid phase is no longer continuous. The condensed area fraction at different surface pressures is listed in Table 2 and plotted in Fig. 6 (labeled A; solid circles). Two regimes are easily distinguished according to the slope. The solid fraction increases gradually with surface pressure up to ∼35 mN/m, then much more rapidly. The film is effectively all solid phase above the plateau pressure. The original fraction of DPPC in Survanta is ∼70%. Taking into account the fraction of PA and tripalmitin, which are also likely in the solid phase, the maximum solid phase fraction should be ∼85%. Hence, some of the fluid phase is pushed away from the interface to the subphase. The surfactant films below and above the plateau have different compositions, and both may be different from the composition of the surfactant in the subphase.
FIGURE 5.

Relationship between the morphology of the solid domains in a Survanta film and isotherm features. AFM pictures were taken below (20 and 34 mN/m) and above (>40 mN/m) the plateau in the isotherm. The images were thresholded and the fractional area of the dark phase was determined to evaluate the solid phase fraction as a function of surface pressure (see Table 2 and Fig. 6). Below the plateau, the size of the solid domains (black areas) increases with the surface pressure. The plateau corresponds to the coalescence of these domains.
TABLE 2.
Area fraction of the solid phase domains in Survanta films spread on saline buffer at 25°C
| π/[mN/m] | A/[%] | ±SD |
|---|---|---|
| 10 | 41 | 5 |
| 20 | 57 | 1 |
| 26 | 60 | 1 |
| 30 | 64 | 2 |
| 34 | 70 | 3 |
| 40 | 92 | 3 |
| 49 | 100 | NA |
Films were transferred on mica substrates at constant surface pressure (π), and imaged by atomic force microscopy. The solid fraction area (A) measured and the corresponding standard deviation for a given sample (±SD) are given.
FIGURE 6.

Solid area fraction (measured by AFM) and surface viscosity (η) plotted as a function of surface pressure. For low π the solid fraction area increases steadily and increases quickly at the plateau pressure, indicating the percolation of the solid domains and the expulsion of fluid phase from the interface (see Fig. 4). η increases exponentially (linear on this semilog plot) up to the plateau, then jumps by more than an order of magnitude at the plateau pressure. The viscosity transition is correlated with the large change in the solid fraction area and the jamming of the solid phase domains.
Brewster angle microscopy
The Brewster angle microscopy (BAM) images shown in Fig. 7 confirm the AFM and fluorescence images. In BAM images, the dark background is the fluid phase and the light gray areas are the solid domains at the interface. The sequence of images in Fig. 6 shows the morphological changes in a Survanta film on saline at 25°C during the second compression of the film (labeled 2 in Fig. 1). In BAM images, the solid phase reflects more light, and so appears bright, relative to the fluid phase, which reflects less light, so the contrast is opposite that of the fluorescence and AFM images where the fluid phase appears bright. At 42 mN/m, the BAM image shows that the film appears mainly light gray, which is consistent with the high fraction of solid phase at this surface pressure. The resolution of the BAM is insufficient to tell which phase is continuous. At ∼47 mN/m, the image is uniformly gray, consistent with a film that is homogeneous on the micron scale. At ∼50 mN/m (see image taken at 54.3 mN/m for illustration) white spots appear on top of this uniform background, likely due to three-dimensional protrusions growing out of the interface into the subphase. The bright spots reflect more light than the uniform condensed phase film, and hence are likely thicker than the film. These structures are attributed to the fluid phase material being pushed out of the interface as in the AFM images (Fig. 3). The protrusions become more numerous as the surface pressure increases and aggregate along lines perpendicular to the direction of compression. The film collapse occurs through cracks along these lines. On expansion, the protrusions disappear at ∼20 mN/m; in the isotherm, this corresponds to the surface pressure during expansion when the trough area starts to expand rapidly.
FIGURE 7.
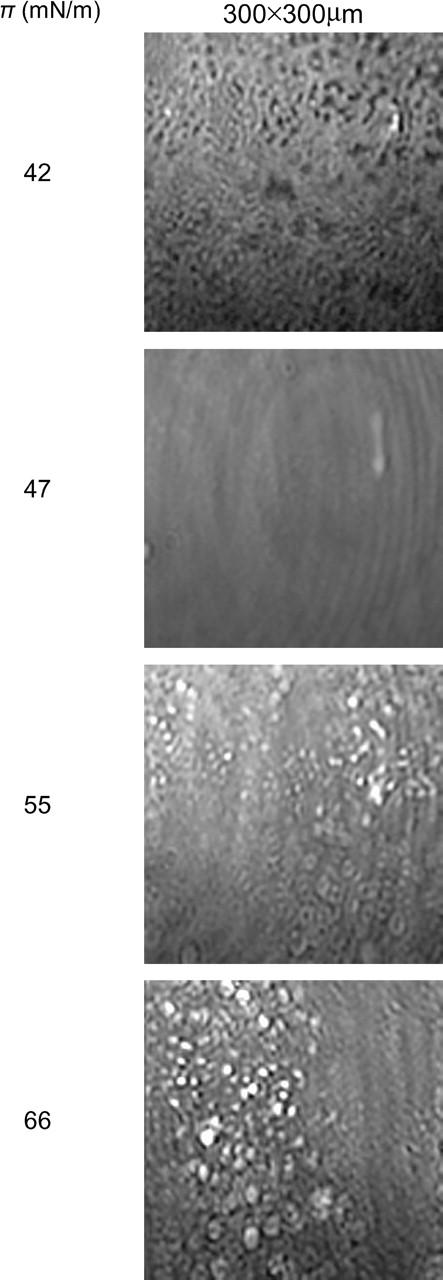
Brewster angle microscopy images of a Survanta film deposited on saline buffer at 25°C taken during the second compression. Each picture is 300 × 300 μm. The contrast is inverted from the fluorescence images—the solid phase is bright and the fluid phase is dark. At the plateau (Fig. 1, zone C) at 42 mN/m, the dark (fluid) phase is mainly eliminated in favor of the bright (solid) phase. The solid phase is beginning to coalesce, as in the fluorescence and AFM images. By 47 mN/m, the contrast is lost, indicative of a homogenous condensed monolayer. On further compression (zone D), bright white spots appear representing three-dimensional aggregates and their number increases up to the collapse pressure (66 mN/m).
Surface viscosity
The consequences of the solid-fluid phase coexistence on the mechanical properties of the film are profound (Diamant et al., 2000; Ding et al., 2002a; Lu et al., 2002; Alonso and Zasadzinski, 2004). The surface viscosity of the film (η; open circles) determined from the magnetic needle viscometer is plotted as a function of surface pressure along with the solid phase fraction (Ding et al., 2002a; Alonso and Zasadzinski, 2004) in Fig. 6. The different regimes observed correspond closely to the different zones identified on the isotherm (see Fig. 1). Below 10 mN/m (zone A) the surface viscosity is constant at a low value, similar to other continuous fluid phase monolayers (Ding et al., 2002a,b; Alonso and Zasadzinski, 2004). In zone B, between 10 and 38 mN/m, the film viscosity increases exponentially with surface pressure (linearly on the semilog plot in Fig. 6); the surface viscosity at 38 mN/m is about one order of magnitude greater than at 10 mN/m. However, at the plateau surface pressure (zone C), at which the condensed phase fraction shows a dramatic change, the viscosity suddenly increases by almost two orders of magnitude. At the end of the plateau, the film is so viscous that the needle cannot move even at the highest force available with the magnetic needle viscometer. The jamming of the solid domains is responsible for the sudden increase in the surface shear viscosity (Ding et al., 2002a,b; Alonso and Zasadzinski, 2004).
The direct correspondence between solid phase fraction and the surface viscosity is similar to other monolayers exhibiting solid-fluid phase coexistence (Ding et al., 2002a,b; Alonso and Zasadzinski, 2004). The film mechanical properties at coexistence are the two-dimensional analog of a three-dimensional suspension of solids in a liquid (Ding et al., 2002a,b; Alonso and Zasadzinski, 2004). In three-dimensional suspensions, as the solid volume fraction, φ, approaches the volume fraction for random close packing, φc, the viscosity diverges as  ; μ is the steady shear viscosity of the dispersion, μo is the viscosity of the suspending liquid, and the exponent, a, varies from 1 to 2 depending on the interactions between the solids (Brady, 1993). The surface viscosity of lipid monolayers at coexistence for a variety of compositions, surface pressures, and temperatures diverges in a similar fashion:
  ; ηo is the surface viscosity of the continuous, fluid phase, and η is the effective surface viscosity of the monolayer (Ding et al., 2002a,b). A is the area fraction of the solid phase and Ac is a critical solid phase fraction at which the solid domains jam into each other and the viscosity diverges. Relatively small changes in the fluid/solid ratio can lead to order of magnitude changes in the surface viscosity near Ac (Ding et al., 2002a,b). Fig. 8 A shows the measured surface viscosity of Survanta as a function of the solid phase area fraction. The dotted line is a fit to
  with η0 = 0.0003 mN-s/m (equivalent to surface poise) and Ac = 0.9.
FIGURE 8.
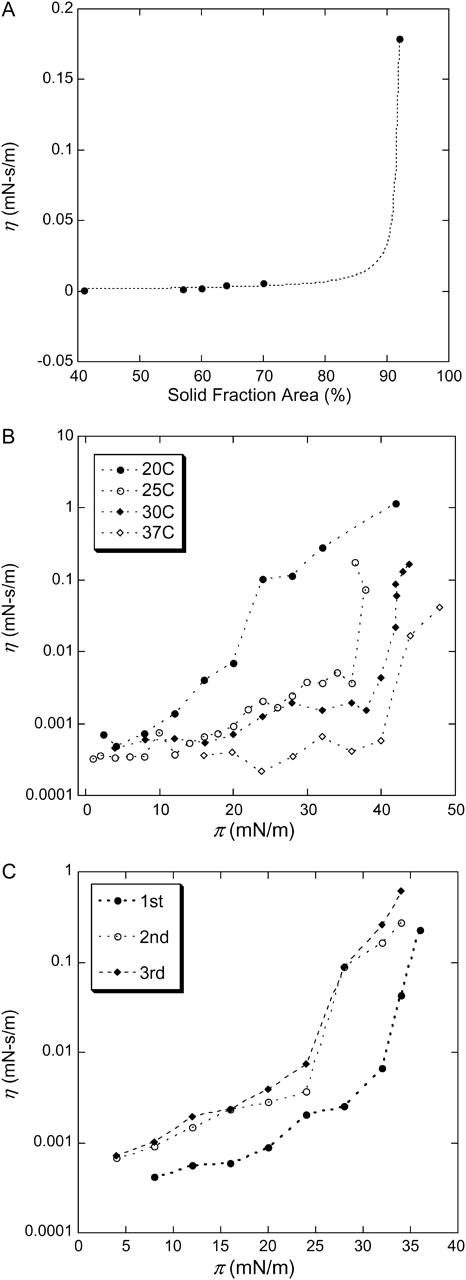
(A) Surface viscosity (η) plotted as a function of the solid fraction area, A, for a Survanta film deposited on saline buffer at 25°C. The dotted line is a fit to  with η0 = 0.0003 mN-s/m and Ac = 0.9 (Ding et al., 2002a). It was difficult to prepare films for AFM evaluation over the narrow range in surface pressure during which the solid phase fraction changed from 70 to 90% (see Table 2). (B) Surface shear viscosity (η) measured as a function of surface pressure (π) for a Survanta film deposited on saline buffer as a function of temperature for 20, 25, 30, and 37°C. The basic features of the surface viscosity response are the same at all temperatures. The surface pressure at which the viscosity transition occurs increases with increasing temperature, consistent with the shift of the plateau in the isotherm and the critical area fraction toward higher surface pressure with temperature. (C) Surface shear viscosity (η) of Survanta film at 25°C for three consecutive compression-expansion cycles. The viscosity transition occurs at a lower surface pressure for the second and third cycles, consistent with the differences in the isotherms in Fig. 1. The overall viscosity is higher as well. This is consistent with the loss fluid phase as shown in the isotherms in Fig. 1 and the images in Figs. 2 and 4.
For simple lipid monolayers at coexistence, Ac varies from ∼0.5 to 0.75, as measured from fluorescence images (Ding et al., 2002a,b). Ac is smallest for films with monodisperse, irregularly shaped solid domains, and largest for polydisperse circular solid domains, as is the case for Survanta (see Fig. 4). Ac for the Survanta films measured by AFM is larger than the Ac measured for the lipid films by fluorescence. However, the smaller solid domains in the AFM images are below the resolution of fluorescence images, and so fluorescence imaging may underestimate the solid phase fraction. On the other hand, transfer to the solid support may nucleate additional solid phase domains in surfactant films, and AFM may overestimate the solid phase. In either case, the viscosity transition is well described by the percolation model. Physically, as the needle is dragged through the film, it pushes the solid domains apart and the drag on the needle is primarily from the continuous fluid phase. However, as the area fraction of solid domains increases, the domains can no longer be easily pushed aside, and at Ac, the solid phase domains jam together and can no longer slide past each other. Hence, the needle must shear through the solid phase, instead of the fluid phase. Ac is also known as the percolation limit in the physics literature (Ding et al., 2002a,b). η increases dramatically from the surface viscosity of the fluid phase to that of the solid as A approaches Ac (Ding et al., 2002a,b).
Although temperature and composition affect the shear viscosity, it is primarily by their influence on the solid phase area fraction, A, and Ac. For Survanta, the isotherms in Fig. 1 are similar and show the same general features (zones A–E) at any temperature from 20 to 37°C. The slopes below and above the plateau get steeper as the temperature is decreased and the plateau surface pressure increases with increasing temperature: 38 mN/m at 25°C, 40 mN/m at 30°C, and 42 mN/m at 37°C. Lower temperatures increase the crystallinity of the film, thus the fraction of condensed phase increases when the temperature drops (Kaganer et al., 1999; Ding et al., 2002a). Hence, the surface pressure at which the surface viscosity increases should increase with increasing temperature, as shown in Fig. 8 B. At 20°C, η jumps at ∼20 mN/m, at ∼35 mN/m at 25°C, at ∼40 mN/m at 30°C, and ∼43 mN/m at 37°C. In all cases, the jumps are associated with the plateau in the isotherm and the rapid increase in solid phase fraction. At all temperatures, the surface viscosity at the limiting surface pressure is so great that the needle in the viscometer cannot move even under the highest forces applied by the magnetic coils.
As with the isotherms, successive cycles also change the surface viscosity (Fig. 8 C) at 25°C; the surface pressure at the viscosity transition decreases by ∼10 mN/m from the first to the second cycle, and is relatively constant after the first cycle. This is consistent with the isotherms (Fig. 1) and fluorescence images (Fig. 2) that suggest a decrease in the fluid phase and an increase in the solid phase fraction on cycling. η lifts off at ∼25 mN/m on the second and third compressions, well below the ∼38 mN/m surface pressure at which the surface viscosity changes on the first compression. This is consistent with the loss of fluid phase during the first cycle. The condensed fraction area is increased with respect to the fluid phase area at a given surface pressure on the second and subsequent cycles, which lowers the surface pressure at which the percolation threshold is reached. This shows again that the first compression removes any excess material from the interface and refines the composition for subsequent cycles. The composition variation then leads to important changes in the mechanical properties of the film.
CONCLUSIONS
Survanta contains ∼65% DPPC, ∼10% fatty acid (PA), 10% saturated tripalmitin, a relatively small fraction of unsaturated lipids, and ∼1% of the surfactant protein C. This balance of components is suitable to achieve two required properties of a good lung surfactant: the ability to reduce surface tension to value near zero and the ability to respread efficiently. These key features can be understood by the characteristic morphology of Survanta as a function of surface pressure: a distinct change from a continuous fluid phase separating discrete solid phase domains at low surface pressure to a percolated solid phase at higher surface pressures. Adsorption from an aqueous suspension leads to the formation of a multilayer reservoir of fluid phases at low surface pressure that are eventually removed at higher surface pressure. The DPPC and PA added to Survanta enhance the formation of solid phase domains as the two components can cocrystallize together at lower surface pressures than DPPC alone (Bringezu et al., 2001; Lee et al., 2002). From the GIXD results, a second solid phase, most likely containing the tripalmitin, also is in coexistence with the fluid phase.
Once formed, the solid domains are resistant to flow. The surface viscosity varies by orders of magnitude near the critical solid phase area fraction at which the solid domains jam. The surface viscosity transition depends on both temperature and number of compression-expansion cycles through the variation in solid-fluid phase coexistence. At low surface tensions, the Survanta film is a solid, elastic sheet capable of withstanding shear stress. The lack of SP-B in Survanta likely allows too much of the fluid phase to be removed at high surface pressure; adding SP-B to Survanta enables the fluid phase to remain at higher surface pressure, which modifies the collapse structures (Ding et al., 2001). The reformation of the fluid network on expansion to lower surface pressure is facilitated by the formation of a reservoir of fluid lipid aggregates in the vicinity of the interface, which is stabilized by SP-B and SP-C (von Nahmen et al., 1997; Schürch et al., 1998; Ding et al., 2001, 2003; Takamoto et al., 2001). However, isotherms, optical and AFM imaging, and surface shear viscosity show that this phenomenon is not particularly efficient for Survanta: a film subjected to compression-expansion cycles moves to smaller areas and gets more rigid with time, indicating the loss of fluid material.
In addition to controlling respreading, the surface viscosity may be a crucial parameter in determining the collapse pressure and collapse structures (Ding et al., 2001; Lu et al., 2002). The surface pressure at which the monolayer collapses determines the minimum surface tension of the film. The equilibrium spreading pressure, ∼45 mN/m for DPPC, gives the maximum surface pressure of a monolayer at equilibrium. However, Lu et al. (2002) suggest that to nucleate monolayer collapse requires an activation energy that depends on the film rigidity; collapse pressures >45 mN/m are, therefore, a kinetic effect. A low viscosity film is more likely to collapse at the equilibrium spreading pressure as the activation energy is low, whereas a more rigid film requires a higher surface pressure to initiate collapse due to the higher activation energy (Lu et al., 2002). Hence, according to this theory, a surfactant film should have a high surface viscosity at low surface tension to maximize the collapse pressure. A low surface viscosity at high surface tension would facilitate spreading. The surface viscosity of Survanta films increases by at least three orders of magnitude from low to high surface pressure and is controlled by the balance between solid and fluid phase fractions, which is ultimately controlled by the ratio of saturated lipids, fatty acids, and triglycerides to unsaturated lipids and proteins.
A high viscosity at low surface tension might also be important to maintaining surfactant in the alveoli. To maintain proper lung function, the surface tension in the alveoli must be nearly zero on exhalation. The surface tension in the trachea remains at ∼30 mN/m (Im Hof et al., 1997) and the surface tension in the connecting airways is estimated at ∼15 mN/m (Geiser et al., 2003). As a result, a surface-tension gradient exists between the trachea, airways, and the alveoli during exhalation. Surface-tension gradients induce flow and the transport of surfactant and other materials in the direction of the higher surface tension (Sacchetti et al., 1993). Instillation of replacement surfactants in premature infants (in which the higher surface tension is in the alveolus), occurs by surface-tension-driven flows in the smaller airways and alveoli and takes only minutes to occur in practice (Bull et al., 1999; Espinosa and Kamm, 1999). Reversing the direction of the surface-tension gradient in normal lungs would suggest that the flow of surfactant from the lungs be just as fast in the absence of a high surface viscosity. However, in normal lungs, surfactant remains in the alveoli for hours and is eventually recycled via the type II cells (Notter, 2000). This requires that the surface viscosity, which provides the resistance to surface-tension-induced flow, increase with decreasing surface tension to offset the surface-tension gradient and minimize the loss of surfactant. Hence, an immobile film of Survanta at low surface tension would help to keep the surfactant in the alveoli and the elasticity of the film would help maintain the alveoli at full expiration to avoid atelectasis (alveolar collapse). However, if the surface viscosity transition is at too low of a surface pressure, instillation of surfactant during treatment of neonatal RDS would be slowed. Hence, optimization of clinical surfactants may require optimization of the viscosity transition surface pressure by manipulating the saturated lipid and protein content.
Acknowledgments
We thank H. W. Taeusch and A. J. Waring for ongoing collaborations and J. Clements for enlightening us about lung physiology, and K. Kjaer for support in beamline setup.
Financial support at University of California, Santa Barbara was provided from the National Institutes of Health (grant HL-51177) and the University of California Tobacco Related Disease Research Program (grant 11RT-0222). F.B. acknowledges financial support from the Deutsche Forschungsgemeinschaft (BR 1826/3-4) and beam time at HASYLAB in Hamburg, Germany.
References
- Alonso, C., A. J. Waring, and J. Zasadzinski. 2004. Keeping lung surfactant where it belongs: protein regulation of two-dimensional viscosity. Biophys. J. In press. [DOI] [PMC free article] [PubMed]
- Alonso, C., and J. Zasadzinski. 2004. Linear dependence of surface drag on surface viscosity. Phys. Rev. E. 69:021602. [DOI] [PubMed] [Google Scholar]
- Als-Nielsen, J., D. Jacquemain, K. Kjaer, L. Lahav, F. Leveiller, and L. Leiserowitz. 1994. Principles and applications of grazing incidence x-ray and neutron scattering from ordered molecular monolayers at the air-water interface. Phys. Rep. 246:251–313. [Google Scholar]
- Als-Nielsen, J., and H. Möhwald. 1991. Synchrotron X-ray Scattering Studies of Langmuir Films. S. Ebashi, M. Koch, and E. Rubinstein, editors. Elsevier, Amsterdam, The Netherlands.
- Bangham, A. D., C. J. Morley, and M. C. Phillips. 1979. The physical properties of an effective lung surfactant. Biochim. Biophys. Acta. 573:552–556. [DOI] [PubMed] [Google Scholar]
- Bernhard, W., J. Mottaghian, A. Gebert, G. A. Rau, H. von der Hardt, and C. F. Poets. 2000. Commercial versus native surfactants. Am. J. Resp. Crit. Care Med. 162:1524–1533. [DOI] [PubMed] [Google Scholar]
- Bloom, B. T., J. Kattwinkel, R. T. Hall, P. M. Delmore, E. A. Egan, R. Trout, M. H. Malloy, D. R. Brown, I. R. Holzman, C. H. Coghill, W. A. Carlo, A. K. Pramanik, et al. 1997. Comparison of Infasurf to Survanta in the treatment and prevention of respiratory distress syndrome. Pediatrics. 100:31–38. [DOI] [PubMed] [Google Scholar]
- Brady, J. F. 1993. The rheological behavior of concentrated colloidal dispersions. J. Chem. Phys. 99:567–581. [Google Scholar]
- Brezesinski, G., A. Dietrich, B. Struth, C. Bohm, W. G. Bouwman, K. Kjaer, and H. Möhwald. 1995. Influence of ether linkages on the structure of double-chain phospholipid monolayers. Chem. Phys. Lipids. 76:145–157. [Google Scholar]
- Brezesinski, G., M. Thoma, B. Struth, and H. Möhwald. 1996. Structural changes of monolayers at the air/water interface contacted with N-alkanes. J. Phys. Chem. 100:3126–3130. [Google Scholar]
- Bringezu, F., J. Q. Ding, G. Brezesinski, and J. A. Zasadzinski. 2001. Changes in model lung surfactant monolayers induced by palmitic acid. Langmuir. 17:4641–4648. [Google Scholar]
- Bull, J. L., L. K. Nelson, J. T. J. Walsh, M. R. Glucksberg, S. Schurch, and J. B. Grotberg. 1999. Surfactant-spreading and surface-compression disturbance on a thin viscous film. J. Biomed. Eng. 121:89–98. [DOI] [PubMed] [Google Scholar]
- Clark, R. H., R. L. Auten, and J. Peabody. 2001. A comparison of the outcomes of neonates treated with two different natural surfactants. J. Pediatr. 139:828–831. [DOI] [PubMed] [Google Scholar]
- Cruz, A., L. Vazquez, M. Velez, and J. Perez-Gil. 2004. Effect of pulmonary surfactant protein SP-B on the micro and nanostructure of phospholipid films. Biophys. J. 86:308–320. [DOI] [PMC free article] [PubMed] [Google Scholar]
- Cruz, A., L. A. D. Worthman, A. G. Serrano, C. Casals, K. M. W. Keough, and J. Perez-Gil. 2000. Microstructure and dynamic surface properties of surfactant protein SP-B/dipalmitoyphosphatidylcholine interfacial films spread from lipid-protein bilayers. Eur. Biophys. J. 29:204–213. [DOI] [PubMed] [Google Scholar]
- Diamant, H., T. A. Witten, A. Gopal, and K. Y. C. Lee. 2000. Unstable topography of biphasic surfactant monolayers. Europhys. Lett. 52:171–177. [Google Scholar]
- Diemel, R. V., M. M. E. Snel, L. M. G. van Golde, G. Putz, H. P. Haagsman, and J. J. Batenburg. 2002a. Effects of cholesterol on surface activity and surface topography of spread surfactant films. Biochemistry. 41:15007–15016. [DOI] [PubMed] [Google Scholar]
- Diemel, R. V., M. M. E. Snel, A. J. Waring, F. J. Walther, L. M. G. Van Golde, G. Putz, H. P. Haagsman, and J. J. Batenburg. 2002b. Multilayer formation upon compression of surfactant monolayers depends on protein concentration as well as lipid composition. J. Biol. Chem. 277:21179–21188. [DOI] [PubMed] [Google Scholar]
- Ding, J., I. Doudevski, H. E. Warriner, T. Alig, J. Zasadzinski, A. J. Waring, and M. A. Sherman. 2003. Nanostructure changes in lung surfactant monolayers induced by interactions between palmitoyloleoylphophatidylglycerol and surfactant protein B. Langmuir. 19:1539–1550. [Google Scholar]
- Ding, J. Q., D. Y. Takamoto, A. von Nahmen, M. M. Lipp, K. Y. C. Lee, A. J. Waring, and J. A. Zasadzinski. 2001. Effects of lung surfactant proteins, SP-B and SP-C, and palmitic acid on monolayer stability. Biophys. J. 80:2262–2272. [DOI] [PMC free article] [PubMed] [Google Scholar]
- Ding, J., H. E. Warriner, and J. A. Zasadzinski. 2002a. Viscosity of two-dimensional suspensions. Phys. Rev. Lett. 88:168201. [DOI] [PubMed] [Google Scholar]
- Ding, J. Q., H. E. Warriner, J. A. Zasadzinski, and D. K. Schwartz. 2002b. Magnetic needle viscometer for Langmuir monolayers. Langmuir. 18:2800–2806. [Google Scholar]
- Discher, B. M., K. M. Maloney, D. W. Grainger, C. A. Sousa, and S. B. Hall. 1999a. Neutral lipids induce critical behavior in interfacial monolayers of pulmonary surfactant. Biochemistry. 38:374–383. [DOI] [PMC free article] [PubMed] [Google Scholar]
- Discher, B. M., W. R. Schief, V. Vogel, and S. B. Hall. 1999b. Phase separation in monolayers of pulmonary surfactant phospholipids at the air-water interface: composition and structure. Biophys. J. 77:2051–2061. [DOI] [PMC free article] [PubMed] [Google Scholar]
- Dluhy, R. A., Z. Ping, K. Faucher, and J. M. Brockman. 1998. Infrared spectroscopy of aqueous biophysical monolayers. Thin Solid Films. 327–329:308–314.
- Espinosa, F. F., and R. D. Kamm. 1999. Bolus dispersal through the lungs in surfactant replacement therapy. J. Appl. Physiol. 86:391–410. [DOI] [PubMed] [Google Scholar]
- Geiser, M., S. Schürch, and P. Gehr. 2003. Influence of surface chemistry and topography of particles on their immersion into the lung's surface-lining layer. J. Appl. Physiol. 94:1793–1801. [DOI] [PubMed] [Google Scholar]
- Goerke, J. 1998. Pulmonary surfactant: functions and molecular composition. Biochim. Biophys. Acta. 1408:79–89. [DOI] [PubMed] [Google Scholar]
- Gopal, A., and K. Y. C. Lee. 2001. Morphology and collapse transitions in binary phospholipid monolayers. J. Phys. Chem. B. 105:10348–10354. [Google Scholar]
- Halliday, H. L. 1995. Overview of clinical trials comparing natural and synthetic surfactants. Biol. Neonate. 67:32–47. [DOI] [PubMed] [Google Scholar]
- Helm, C. A., H. M̈ohwald, K. Kjaer, and J. Als-Nielsen. 1987. Phospholipid monolayers between fluid and solid states. Biophys. J. 52:381–390. [DOI] [PMC free article] [PubMed] [Google Scholar]
- Hénon, S., and J. Meunier. 1991. Microscopy at the Brewster angle: direct observation of first order phase transitions in monolayers. Rev. Sci. Instrum. 62:963–969. [Google Scholar]
- Im Hof, V., P. Gerh, V. Gerber, M. M. Lee, and S. Schürch. 1997. In vivo determination of surface tension in the horse and in vitro model studies. Respir. Physiol. 109:81–93. [DOI] [PubMed] [Google Scholar]
- Kaganer, V. M., H. Möhwald, and P. Dutta. 1999. Structure and phase transitions in Langmuir monolayers. Rev. Mod. Phys. 71:779–819. [Google Scholar]
- Keller, S. L., T. G. Anderson, and H. McConnell. 2000. Miscibility critical pressures in monolayers of ternary lipid mixtures. Biophys. J. 79:2033–2042. [DOI] [PMC free article] [PubMed] [Google Scholar]
- Lee, K. Y. C., A. Gopal, A. Von Nahmen, J. A. Zasadzinski, J. Majewski, G. S. Smith, P. B. Howes, and K. Kjaer. 2002. Influence of palmitic acid and hexadecanol on the phase transition temperature and molecular packing of dipalmitoylphophatidyl-choline monolayers at the air-water interface. J. Chem. Phys. 116:774–783. [Google Scholar]
- Lipp, M. M., K. Y. C. Lee, D. Y. Takamoto, J. A. Zasadzinski, and A. J. Waring. 1998. Coexistence of buckled and flat monolayers. Phys. Rev. Lett. 81:1650–1653. [Google Scholar]
- Lipp, M. M., K. Y. C. Lee, J. A. Zasadzinski, and A. J. Waring. 1996. Phase and morphology changes in lipid monolayers induced by SP-B protein and its amino-terminal peptide. Science. 273:1196–1199. [DOI] [PubMed] [Google Scholar]
- Lipp, M. M., K. Y. C. Lee, J. A. Zasadzinski, and A. J. Waring. 1997. Design and performance of an integrated fluorescence, polarized fluorescence, and Brewster angle microscope Langmuir trough assembly for the study of lung surfactant monolayers. Rev. Sci. Instrum. 68:2574–2582. [Google Scholar]
- Longo, M. L., A. M. Bisagno, J. A. N. Zasadzinski, R. Bruni, and A. J. Waring. 1993. A function of lung surfactant protein SP-B. Science. 261:453–456. [DOI] [PubMed] [Google Scholar]
- Lu, W. X., C. M. Knobler, R. F. Bruinsma, M. Twardos, and M. Dennin. 2002. Folding Langmuir monolayers. Phys. Rev. Lett. 89:6107–6110. [DOI] [PubMed] [Google Scholar]
- McConnell, H. 1991. Structures and transitions in lipid monolayers at the air-water interface. Annu. Rev. Phys. Chem. 42:171–195. [Google Scholar]
- Mizuno, K., M. Ikegami, C.-M. Chen, T. Ueda, and A. H. Jobe. 1995. Surfactant protein-B supplementation improves in vivo function of a modified natural surfactant. Pediatr. Res. 37:271–276. [DOI] [PubMed] [Google Scholar]
- Nag, K., J. S. Pao, R. R. Harbottle, F. Possmayer, N. O. Peterson, and L. A. Bagatolli. 2002. Segregation of saturated chain lipids in pulmonary surfactant films and bilayers. Biophys. J. 82:2041–2051. [DOI] [PMC free article] [PubMed] [Google Scholar]
- Nag, K., J. Perez-Gil, M. L. F. Ruano, L. A. D. Worthman, J. Stewart, C. Casals, and K. M. W. Keough. 1998. Phase transitions on films of lung surfactant at the air-water interface. Biophys. J. 74:2983–2995. [DOI] [PMC free article] [PubMed] [Google Scholar]
- Notter, R. H. 2000. Lung Surfactant: Basic Science and Clinical Applications. Marcel Dekker, New York; Basel, Switzerland.
- Orgeig, S., and C. B. Daniels. 2001. The roles of cholesterol in pulmonary surfactant: insights from comparative and evolutionary studies. Comp. Biochem. Physiol. A Mol. Integr. Physiol. 129:75–89. [DOI] [PubMed] [Google Scholar]
- Perez-Gil, J. 2002. Molecular interactions in pulmonary surfactant films. Biol. Neonate. 81:6–15. [DOI] [PubMed] [Google Scholar]
- Piknova, B., V. Schram, and S. B. Hall. 2002. Pulmonary surfactant: phase behavior and function. Curr. Opin. Struct. Biol. 12:487–494. [DOI] [PubMed] [Google Scholar]
- Poulain, F. R., S. Nir, and S. Hawgood. 1996. Kinetics of phospholipid membrane fusion induced by surfactant apoproteins A and B. Biochim. Biophys. Acta. 1278:169–175. [DOI] [PubMed] [Google Scholar]
- Sacchetti, M., H. Yu, and G. Zografi. 1993. In-plane steady shear viscosity of monolayers at the air/water interface and its dependence on free area. Langmuir. 9:2168–2171. [Google Scholar]
- Schürch, S., J. Goerke, and J. A. Clements. 1976. Direct determination of surface tension in the lung. Proc. Natl. Acad. Sci. USA. 73:4698–4702. [DOI] [PMC free article] [PubMed] [Google Scholar]
- Schürch, S., J. Goerke, and J. A. Clements. 1978. Direct determination of volume and time-dependence of alveolar surface tension in excised lungs. Proc. Natl. Acad. Sci. USA. 75:3417–3421. [DOI] [PMC free article] [PubMed] [Google Scholar]
- Schürch, S., F. H. Y. Green, and H. Bachofen. 1998. Formation and structure of surface films: captive bubble surfactometry. Biochim. Biophys. Acta. 1408:180–202. [DOI] [PubMed] [Google Scholar]
- Schürch, S., R. Qanbar, H. Bachofen, and F. Possmayer. 1995. The surface-associated surfactant reservoir in the alveolar lining. Biol. Neonate. 67:61–76. [DOI] [PubMed] [Google Scholar]
- Takamoto, D. Y., M. M. Lipp, A. Von Nahmen, K. Y. C. Lee, A. J. Waring, and J. A. Zasadzinski. 2001. Interaction of lung surfactant proteins with anionic phospholipids. Biophys. J. 81:153–169. [DOI] [PMC free article] [PubMed] [Google Scholar]
- Tanaka, Y., T. Takei, T. Aiba, K. Masuda, A. Kiuchi, and T. Fujiwara. 1986. Development of synthetic lung surfactants. J. Lipid Res. 27:475–485. [PubMed] [Google Scholar]
- Teer, E., C. M. Knobler, S. Siegel, D. Vollhardt, and G. Brezesinski. 2000. Grazing incidence diffraction and Brewster-angle microscope studies of mixtures of hexadecanoic acid and methyl hexadecanoate: the unexpected appearance of a phase with nearest-neighbor tilt. J. Phys. Chem. B. 104:10053–10058. [Google Scholar]
- Thoma, M., and H. Möhwald. 1995. Monolayers of dipalmitoylphosphatidylcholine at the oil-water interface. Colloid Surface A. 95:193–200. [Google Scholar]
- Veatch, S. L., and S. L. Keller. 2003. Separation of liquid phases in giant vesicles of ternary mixtures of phospholipids and cholesterol. Biophys. J. 85:3074–3083. [DOI] [PMC free article] [PubMed] [Google Scholar]
- von Nahmen, A., M. Schenk, M. Sieber, and M. Amrein. 1997. The structure of a model pulmonary surfactant as revealed by scanning force microscopy. Biophys. J. 72:463–469. [DOI] [PMC free article] [PubMed] [Google Scholar]
- Walther, F. J., L. M. Gordon, J. A. Zasadzinski, M. A. Sherman, and A. J. Waring. 2000. Surfactant protein B and C analogues. Mol. Genet. Metab. 71:342–351. [DOI] [PubMed] [Google Scholar]
- Walther, F. J., J. Hernandez-Juviel, R. Bruni, and A. J. Waring. 1997. Spiking Survanta with synthetic surfactant peptide improves oxygenation in surfactant-deficient rats. Am. J. Respir. Crit. Care Med. 156:855–861. [DOI] [PubMed] [Google Scholar]
- Warriner, H. E., J. Ding, A. J. Waring, and J. A. Zasadzinski. 2002. A concentration-dependent mechanism by which serum albumin inactivates replacement lung surfactants. Biophys. J. 82:835–842. [DOI] [PMC free article] [PubMed] [Google Scholar]
- Winsel, K., D. Honig, K. Lunkenheimer, K. Geggel, and C. Witt. 2003. Quantitative Brewster angle microscopy of the surface film of human broncho-alveolar lavage fluid. Eur. Biophys. J. 32:544–552. [DOI] [PubMed] [Google Scholar]
- Zasadzinski, J. A., J. Ding, H. E. Warriner, F. Bringezu, and A. J. Waring. 2001. The physics and physiology of lung surfactants. Curr. Opin. Colloid Interface Sci. 6:506–513. [Google Scholar]
- Zasadzinski, J. A., R. Viswanathan, L. L. Madsen, J. Garnaes, and D. K. Schwartz. 1994. Langmuir-Blodgett films. Science. 263:1726–1733. [DOI] [PubMed] [Google Scholar]