
FIGURE 4.
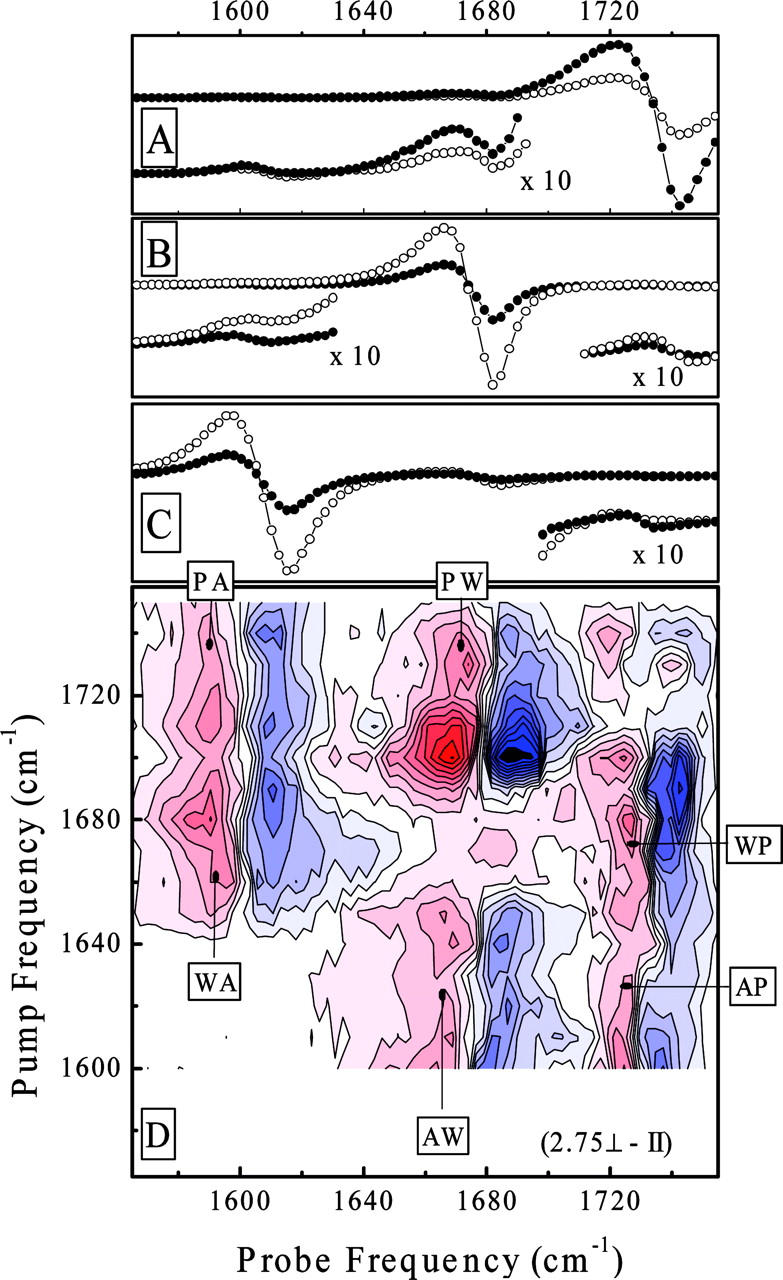
Vertical cut through the 2D-IR spectra of the didpeptide in the phospholipid membranes at pump-pulse frequencies of 1740 cm−1 (A), 1687 cm−1 (B), and 1610 cm−1 (C) for parallel (•) and perpendicular polarizations (○) of pump and probe pulses. The corner inserts show a 10× magnified spectral response in the crosspeak spectral range. D represents the weighted difference between perpendicular and parallel polarization 2D-IR spectra. The markers indicate the crosspeaks between alanine (A), tryptophan (W), and phospholipids (P).