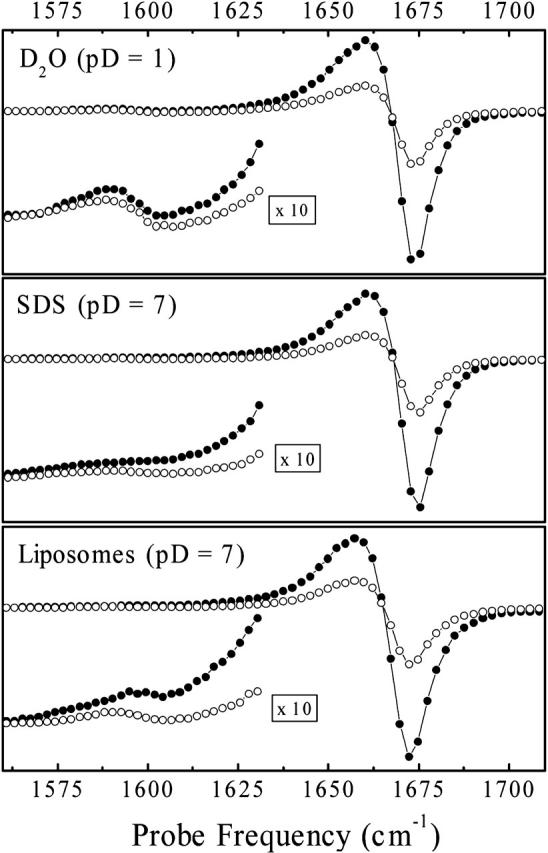
FIGURE 6.

Spectral transients recorded with a pump-pulse frequency of 1675 cm−1 for parallel (•) and perpendicular polarizations (○) of pump and probe pulses. The left lower corner inserts show the 10× magnified spectral response in the crosspeak spectral range.
