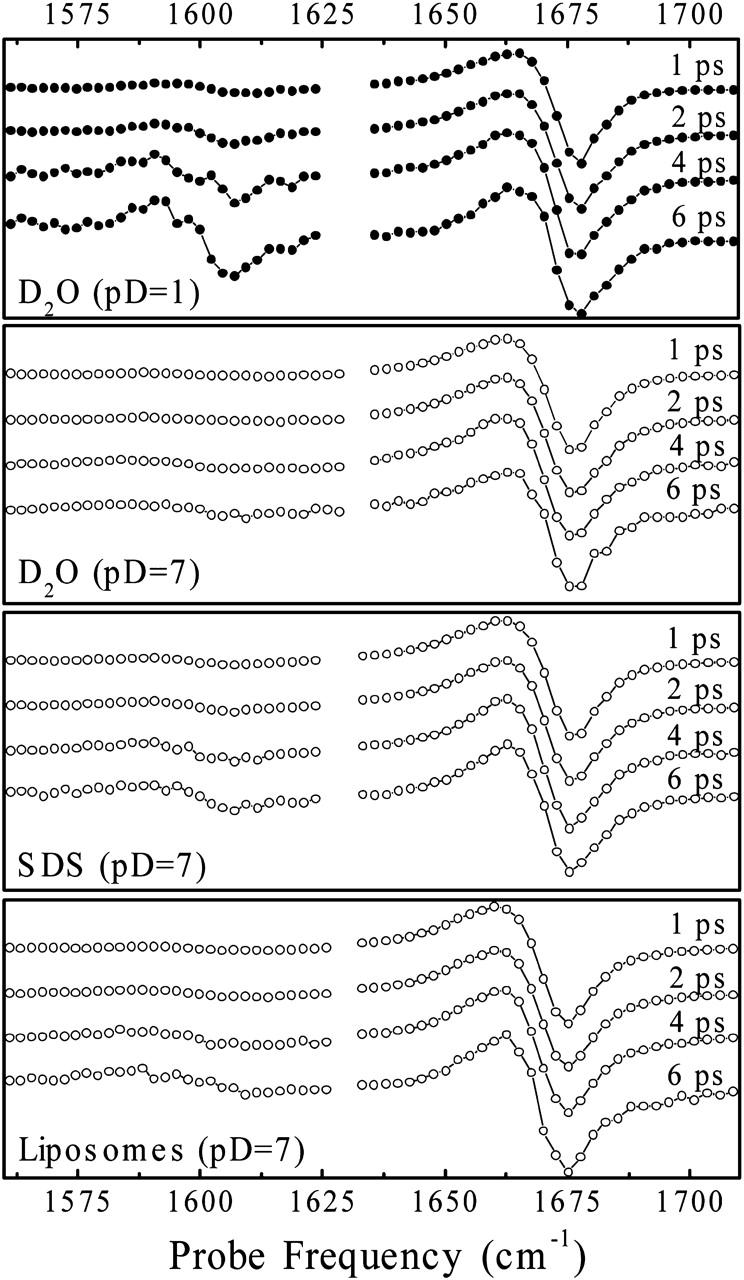
FIGURE 7.

Transient spectra detected as a function of mixing time (1, 2, 4, and 6 ps, from top to bottom) in the indicated samples for a pump pulse frequency of 1675 cm−1. The transients are rescaled to correct for vibrational relaxation out of the initially excited amide I mode.
