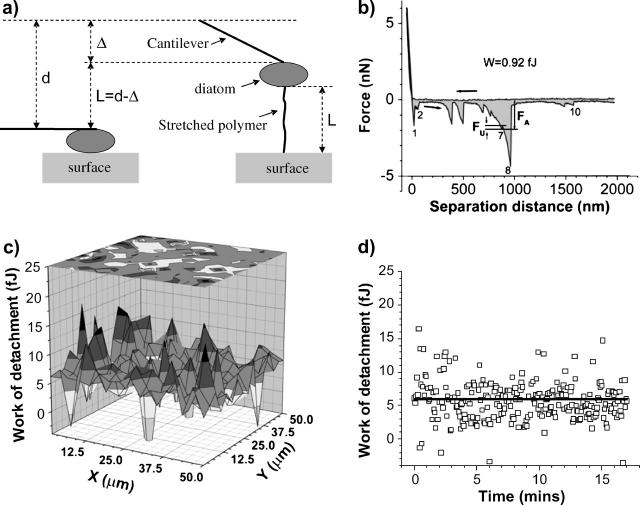
FIGURE 2.
(a) The polymer length, L = d − Δ, is calculated from the piezo displacement, d (called separation distance in the x axis of force versus distance curves), measured from the origin described in the text, and from the cantilever deflection, Δ. (b) An example of a force versus distance curve obtained on an Intersleek surface with a live diatom bioprobe. The work of detachment, W, is represented by the shaded area under the curve, the arrows indicate approach and retract directions. FU and FA show the unbinding and adhesion forces, respectively. (c) 3D mapping of the work of detachment obtained from a 16 × 16 array (spread over a 50 × 50 μm2 area) of force versus distance curves in force-volume mode. At each (x,y) coordinate, the work of detachment (W) is plotted in the z axis. (d) Time representation of the information given in c. The start of data acquisition (time 0) corresponds to the (x = 0, y = 0) point of the spatial array and the last point acquired (after 17 min in this example) corresponds to the force versus distance curve captured in the last point of the array, e.g., (x = 50 μm, y = 50 μm). The straight horizontal line in the graph represents the statistical average value of all points. Negative values are excluded from the analysis.

