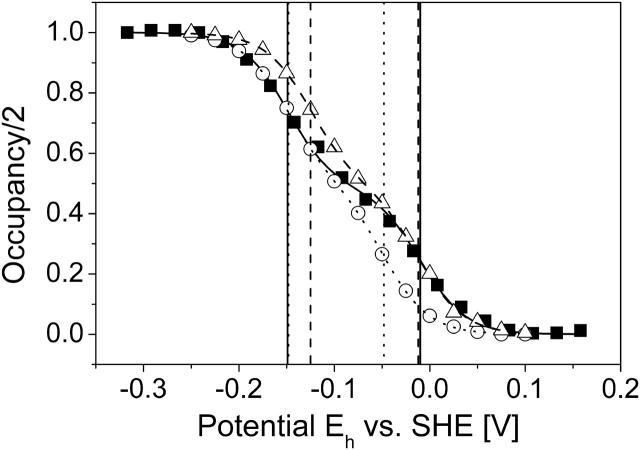
FIGURE 2.
Simulated heme redox titrations. The simulated data as well as the fitted Nernst curves are shown as two-step curves, which represent the sum of two single heme titration curves. The figure shows the simulated and experimental (Lancaster et al., 2000) redox titrations of hemes bP and bD of QFR at pH 7. ▪, Experimental data; ○, simulated data using model X; and ▵, simulated data for model W. The three fitted Nernst curves are also included: ——, experimental; · · · · , simulation, model X; and - - - -, simulation, model W. The vertical lines (same labeling as for the Nernst curves) indicate the positions of the individual oxidation-reduction (midpoint) potentials as they were obtained by the Nernst fit: low-potential heme, −149 mV (experiment), −149 mV (simulation, model X), and −125 mV (simulation, model W); and high-potential heme, −9 mV (experiment), −48 mV (simulation, model X), and −12 mV (simulation, model W). The low-potential heme corresponds to heme bD and the high-potential to bP.

