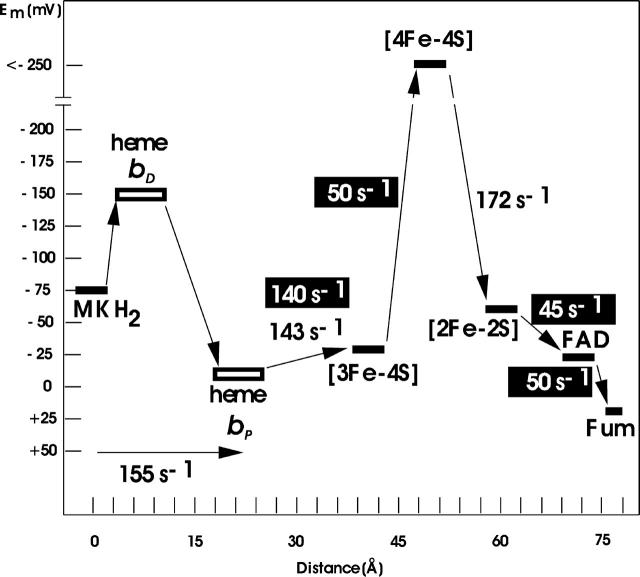
FIGURE 9.
Oxidation-reduction (midpoint) potentials (in mV and at pH 7) of the constituents of the electron transport chain of the W. succinogenes QFR. The distances are given in Å and refer to inter-cofactor distances. Electron transfer rates in white are reoxidation rates of the fully reduced enzyme by fumarate; those in black are reduction rates of the fully oxidized enzyme, as compiled in Lancaster (2004). The assignment of the hemes (bDistal = bLow and bProximal = bHigh) is indicated as obtained by simulated heme redox titrations in the study presented here. The experimental heme midpoint potentials are taken from Lancaster et al. (2002); all others have been compiled in Lancaster (2004).

