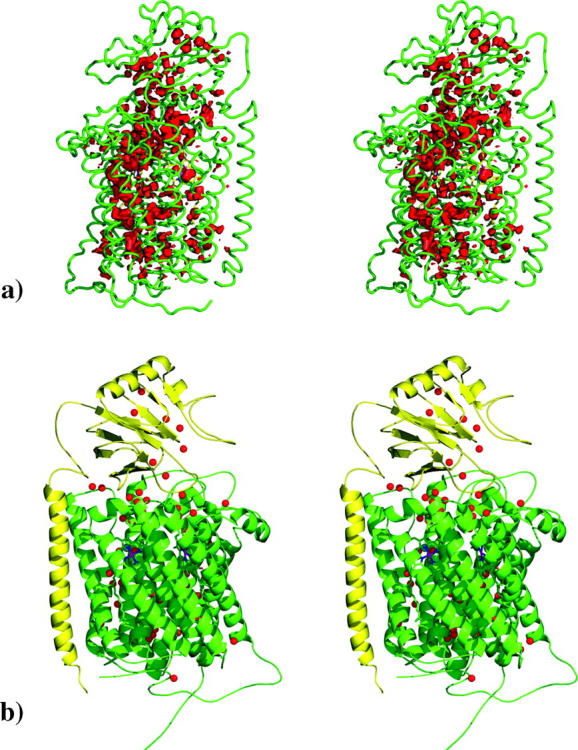
FIGURE 2.

(a) Graphical representation of the WPDF in Aa-aa3. The protein model (subunit I in green and subunit II in yellow) is rendered as ribbon, and the WPDF is rendered as a red contour. Only the regions with WPDF >0.005 are shown. (b) Stereo view of the best model of Aa-aa3 in a cartoon representation, with internal water molecules represented as small red spheres. Subunit I is colored in green, and subunit II is colored in yellow. Heme cofactors are shown in dark blue. This figure was generated with the program Pymol (DeLano, 2003).
