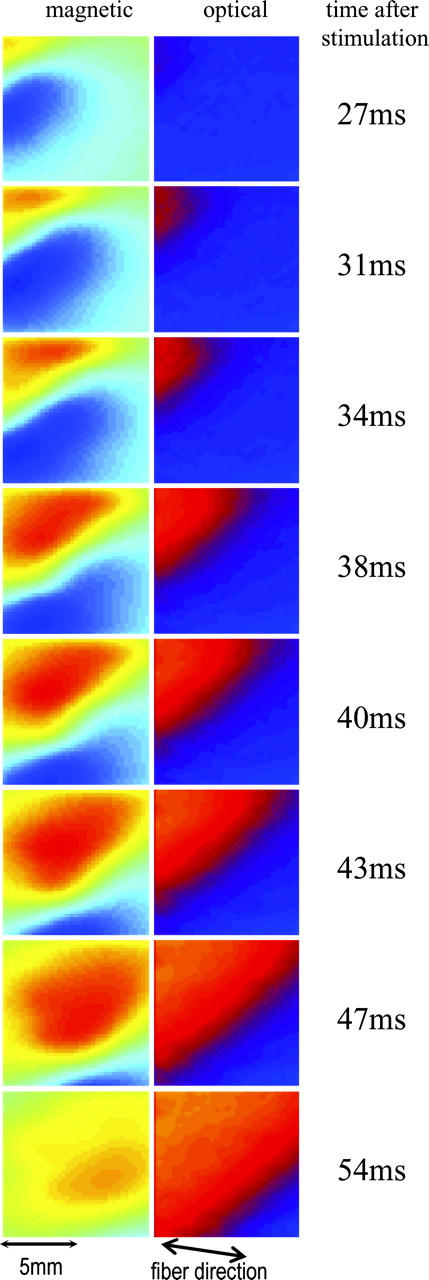
FIGURE 3.

Magnetic (left) and optical (right) images of the progression of a planar excitation wavefront across the imaging area. The wavefront moves diagonally from the top left corner of the imaging area at ∼45° to the fiber orientation. The time elapsed after stimulation is indicated to the right of the frames.
