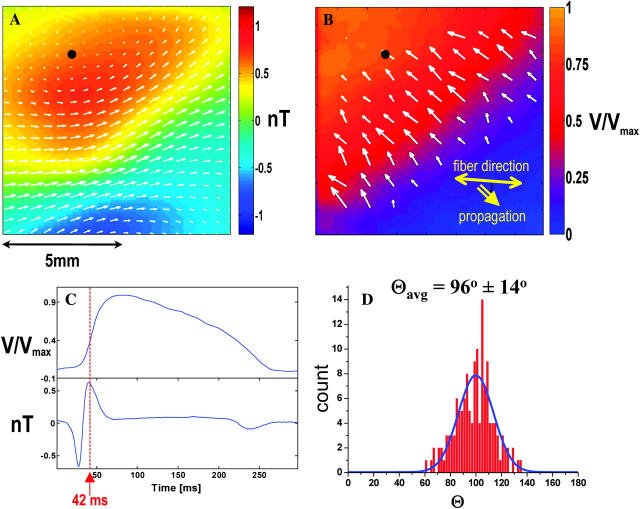
FIGURE 4.
(A) Magnetic image of plane wavefront propagating at an angle of 45° to the fiber direction with arrows indicating the magnitude and direction of the net current. (B) Corresponding optical data with arrows indicating ∇Vm . (C) Time traces from the optical data (top) and the magnetic data (bottom) taken at the points indicated by the black dots in (a) and (b). (D) Angle between net current and ∇Vm.

