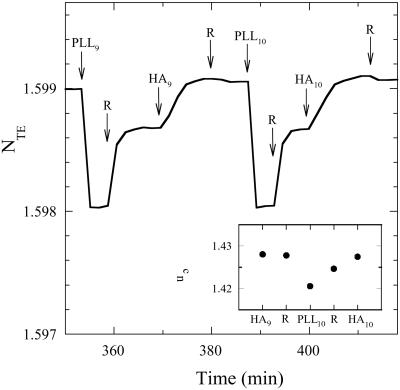
Figure 3.
Effective refractive indexes NTE signal obtained by OWLS during PLL/HA multilayers buildup as a function of the time. The evolution of NTE is shown over two buildup cycles once a continuous film is formed on the surface. PLL and HA were dissolved in 0.15 M NaCl at the following concentrations: PLL at 20 mg/ml and HA at 1 mg/ml. Each arrow corresponds to the beginning of the injection of either HA or PLL or only 0.15 M NaCl (corresponding in this last case to a rinsing step noted R). The number underneath PLL or HA corresponds to the layer pair deposition number. (Inset) The evolution of nc, the refractive index of the film near the waveguide at the end of each buildup step during one buildup cycle.

