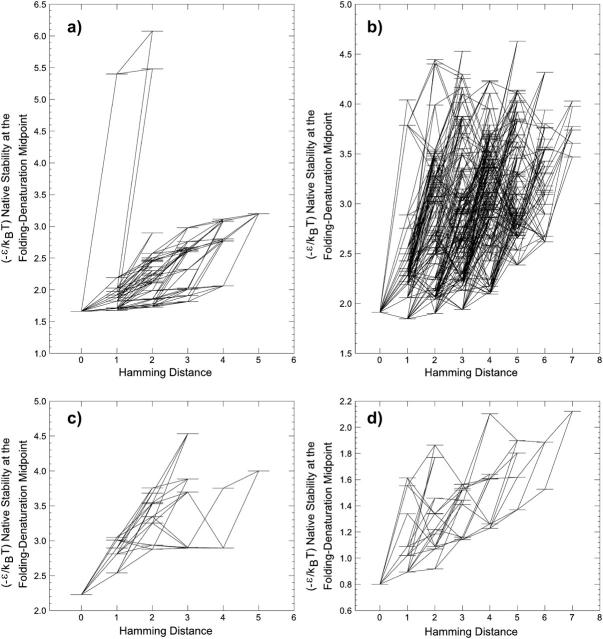
FIGURE 3.
Native stabilities of the (a) HP′, (b) HPmax, (c) AB′, and (d) ABmax sequences in the neutral nets in Fig. 2 are indicated by short horizontal levels. They correspond to the (−ɛ/kBT) value (vertical scale) at the transition midpoint. Neutral single-point mutations (lines in Fig. 2) are indicated here by lines joining horizontal levels. The horizontal scale provides the Hamming distance from the prototype sequence of the given neutral net. Note that each horizontal level in the ABmax neutral net in d represents a sequence as well as the sequence obtained by performing A ↔ B interchange on it.

