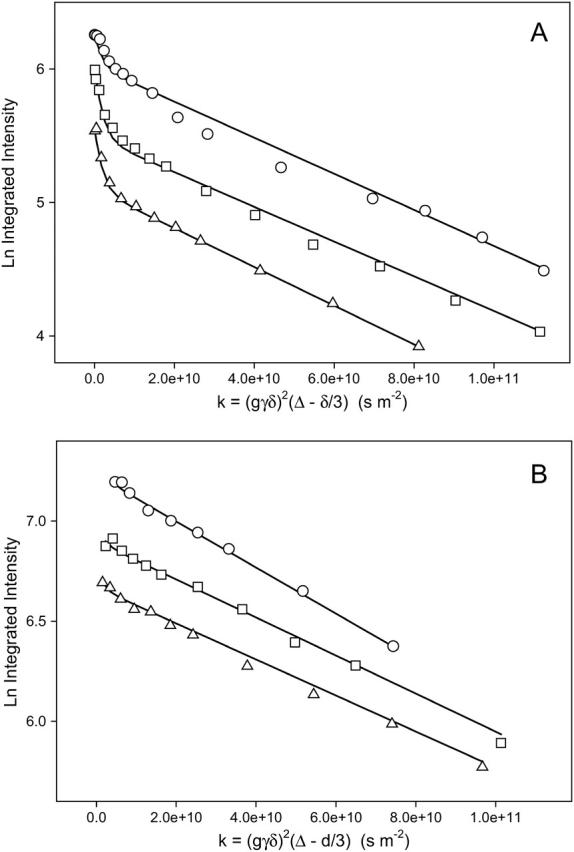
FIGURE 6.

(A) Stimulated echo intensity decays for different diffusion times in STE PFG 1H NMR spectra (35°C) of magnetically aligned DMPC/DHPC (q = 4.5) bicelles + 1 mol % DMPE-PEG 2000. Gradient amplitude 244 G cm−1. (○) ▵ = 215 ms. (□) ▵ = 415 ms. (▵) ▵ = 615 ms. Lines of best fit using Eq. 4 are shown with DDHPC = 5.7 × 10⁻¹⁰ m2s−1, DPEG = 1.35 × 10⁻¹¹ m2s−1, and values of XDHPC, XPEG, T1, and T2 as per Table 1. (B) Stimulated echo intensity decays for different diffusion times in STE PFG 1H NMR spectra (35°C) of magnetically aligned DMPC/Na glycocholate (q = 4.5) bicelles + 1 mol % DMPE-PEG 2000. Gradient amplitude 244 G cm−1. Lines of best fit using Eq. 1 are shown. (○) ▵ = 215 ms, DPEG = 1.10 × 10⁻¹¹ m2s−1. (□) ▵ = 415 ms, DPEG = 0.95 × 10⁻¹¹ m2s−1. (▵) ▵ = 615 ms, DPEG = 0.90 × 10⁻¹¹ m2s−1.
