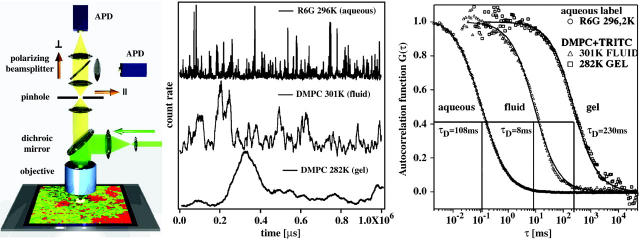
FIGURE 1.
(Left) Schematic drawing of the FCS setup and the simulations. The laser (green) is focused on planar membranes, which are predicted to contain domains. Fluorescence light from the focus (yellow) is projected on two avalanche photodiodes (APD) which monitor different polarizations. In the image plane a pinhole is located. (Center) Single molecule fluorescence intensity traces of rhodamine 6G in solution, TRITC in a fluid lipid membrane and TRITC in a gel lipid membrane. Note the different timescales. (Right) Autocorrelation of the fluorescence signals shown in the center panel. The diffusion timescale within the fluid membrane is much faster than in the gel membrane, but approximately two orders-of-magnitude slower than the free diffusion of a label in the bulk solvent. The solid lines represent fits according to Eq. 1.

