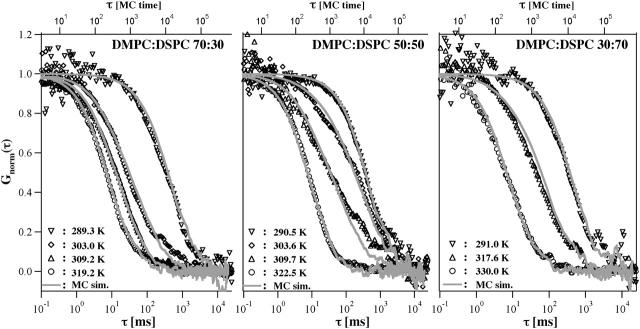
FIGURE 6.
Experimental and theoretical autocorrelation functions of three DMPC/DSPC mixtures at different temperatures. (Left) 70:30 mixture at 289.3 K, 303.0 K, 309.2 K, and 319.2 K (below, within, and above the melting regime; see Fig. 3). (Center) 50:50 mixture at 290.5 K, 303.6 K, 309.7 K, and 322.5 K (below, within, and above the melting regime). (Right) 30:70 mixture at 291.0 K, 317.6 K, and 330.0 K (below, within, and above the melting regime). The experimental profiles are very well described by the simulation. It shall be noted that the simulation exclusively relies on the calorimetric input parameters and does not require any fitting, except for the adjustment of the timescales in the pure gel and the pure fluid phases. All intermediate profiles are predictions rather than fits.

