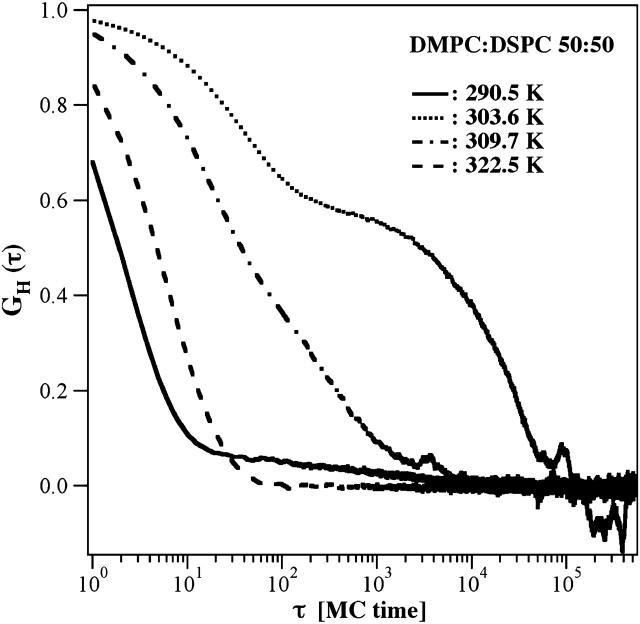
FIGURE 9.
Autocorrelation of the enthalpy fluctuations of a DMPC:DSPC mixture from the simulations in Fig. 6 (center panel), indicating the lipid state relaxation times (Grabitz et al., 2002). The typical steps in the enthalpy fluctuations yield the lipid state relaxation time(s). The relaxation at the cP-maximum at 303.6 K is slowest, whereas it is fastest in the pure gel (290.5 K) and the fluid phases (322.5 K). Relaxation times at 303.6 K are between 101 and 105 Monte Carlo cycles, whereas the mean dwell-time of the label is ∼103 cycles. This indicates that relaxation processes may be slower than the time that a label spends in the microscope focus. For gel and fluid phase simulations (290.5 K and 322.5 K, respectively), relaxation is faster than the dwell-time of the label in the focus (see Fig. 6, center panel).

