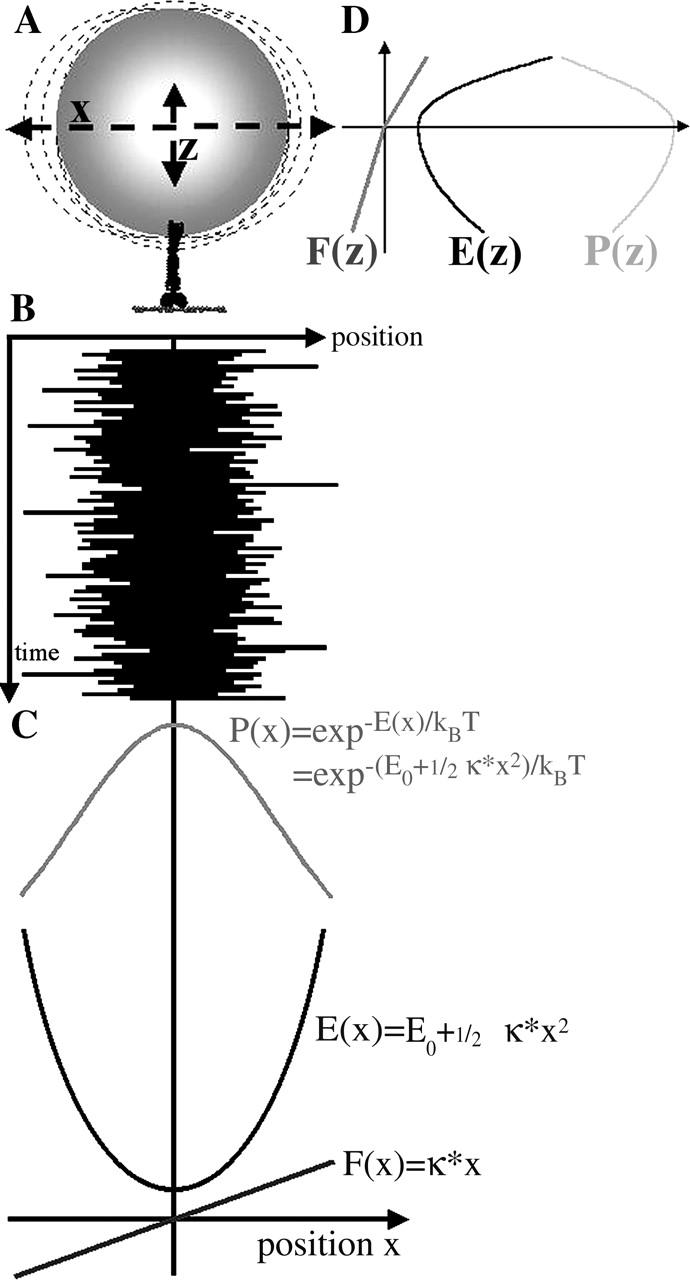
FIGURE 1.

Relations between thermally driven position fluctuations of a tethered bead, probability distribution of bead position, free energy profiles, and force functions along x (linear elasticity assumed) and along z (linear but asymmetric elasticity). (A) Schematic drawing of a microsphere tethered to an actin filament by a single myosin molecule. (B) Time course of bead position along x. (C) Plots of probability distribution of bead position along x, free energy profile, and force function with respect to x. (D) Force function F(z), free energy profile E(z), and probability distribution P(z) for position fluctuations along z.
