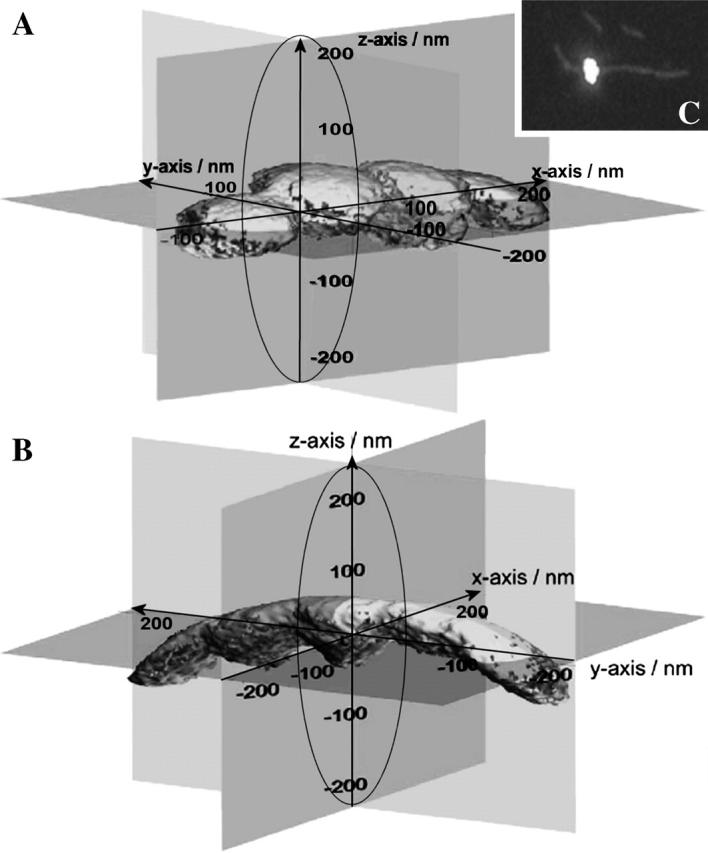
FIGURE 6.

Extension of the range of bead fluctuations (A) along and (B) across the actin filament after the tether had formed. Isoprobability surfaces (95% probability) of the three-dimensional probability distributions of the tethered bead are shown for four different positions along the actin filament axis (x axis; A) and for five different positions across the actin filament axis (y axis; B). The isoprobability surface located at the origin of the coordinates is the surface observed at the position of the bead when the tether had formed. The ellipsoid illustrated by the solid line represents the isoprobability surface observed for the free bead fluctuating in the optical trap just before the tether had formed. (C) Image of a fluorescently labeled microsphere of 500 nm in diameter bound in an ATP-free solution to a single TRITC-phalloidin labeled, biotinylated actin filament immobilized on a neutravidin-coated glass surface.
