
FIGURE 7.
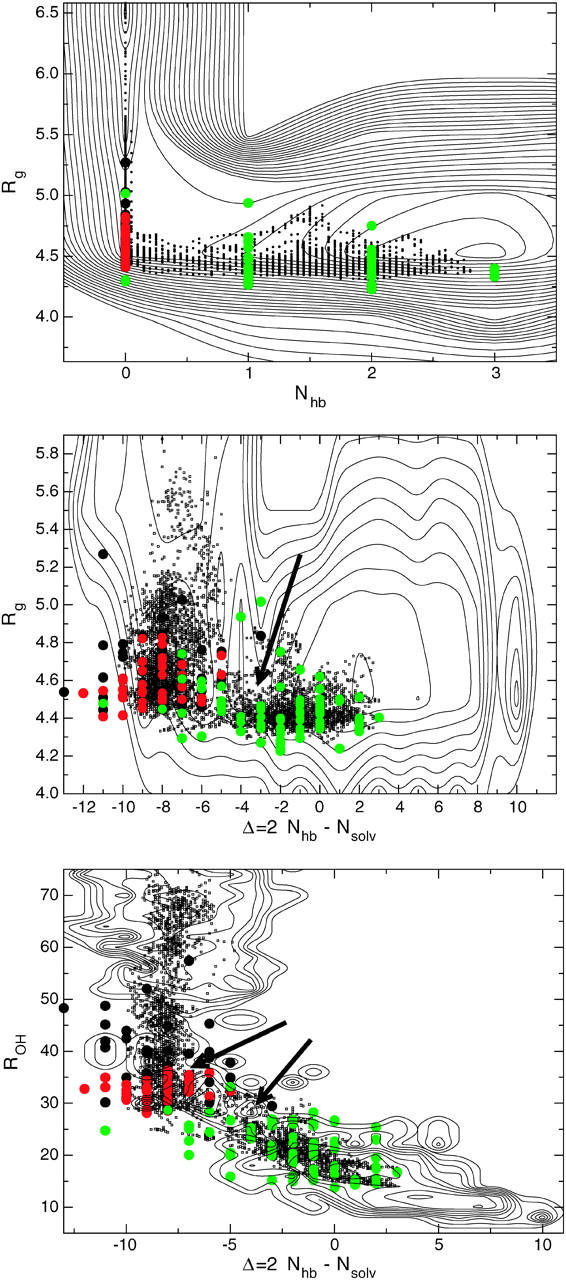
Representations of the F-H transition in three different order parameter planes. The free-energy landscape from replica exchange is given by solid thin contour lines separated by 0.2 kBT. A few smoothed paths in the F-H ensemble are denoted by a scatter plot (small dots). Each dot represents a time slice along a path. Also given are the different committor ensembles: pB < 0.2 green, 0.4 < pB < 0.6 in red, and pB > 0.9 in black. The transition state saddle points in the F-E landscape are indicated by arrows.