FIGURE 4.

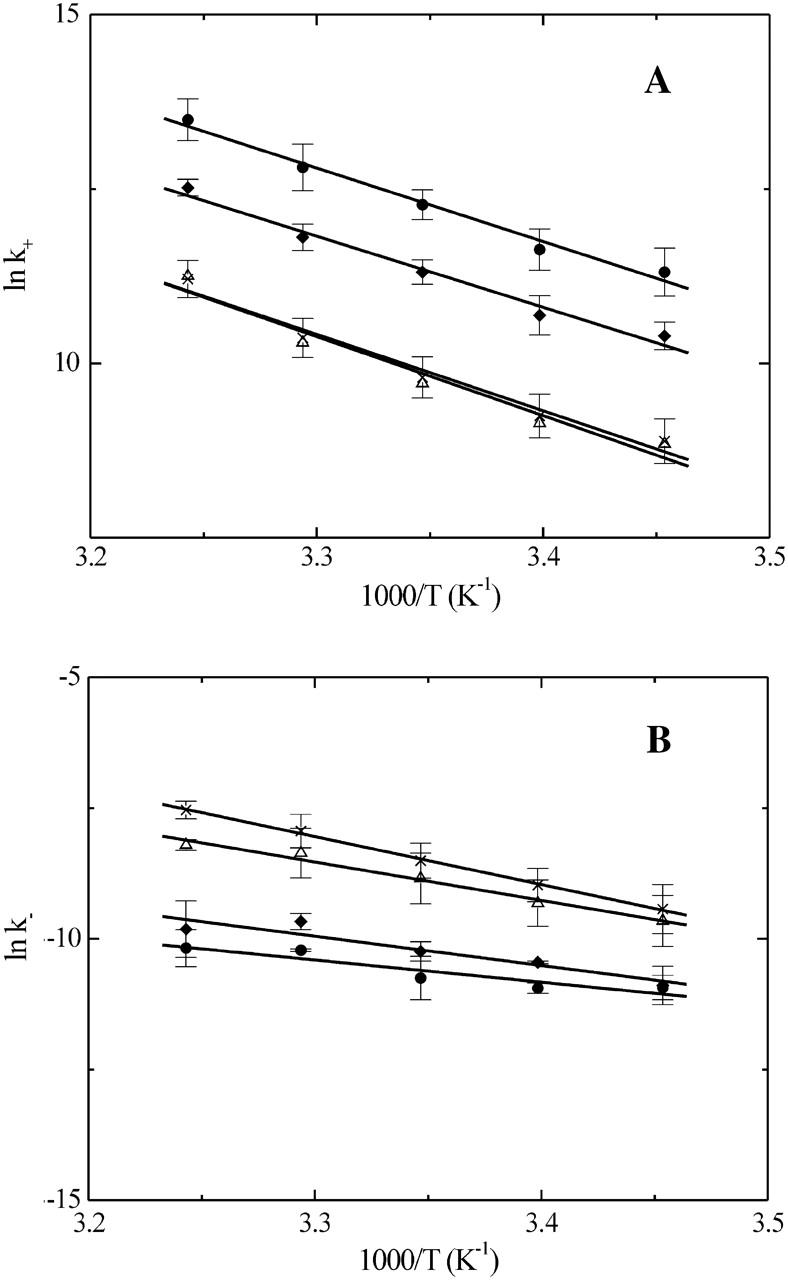
Arrhenius plots for the insertion (panel A) and desorption (panel B) of NBD-DMPE into/from lipoprotein particles. The symbols are the same as in Fig. 3 and the results shown are average values ± SD of three independent experiments.

Arrhenius plots for the insertion (panel A) and desorption (panel B) of NBD-DMPE into/from lipoprotein particles. The symbols are the same as in Fig. 3 and the results shown are average values ± SD of three independent experiments.