
FIGURE 1.
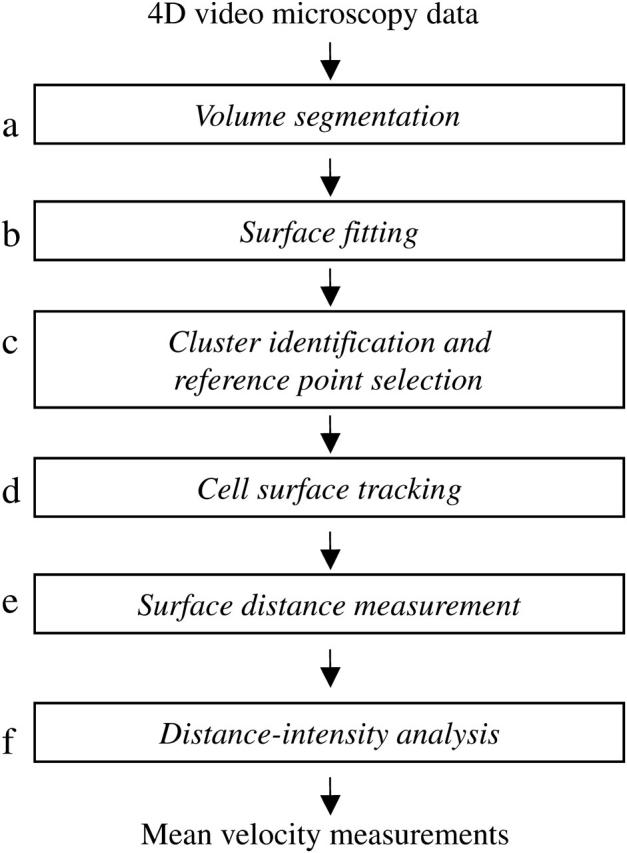
Analytic process for measuring membrane protein velocities. This schema depicts the stages of cell surface reconstruction, clustering analysis, and alignment performed by our system. (a) The volume segmentation filter serves to detect membrane structures in the image volume. Surface reconstruction performed at stage b uses a level-set method to fit a smooth surface to the membrane data points. (c) Clustering analysis is performed at a single time point to identify the center of the brightest cluster, which will serve as the reference point for further analysis. Cell surface tracking information obtained in stage d is then used to propagate this spatial reference point to all time points. (e) Cell surface distances are measured at each time point by a surface walking technique, using the reference point identified in stage d as the origin. (f) The distance information obtained in stage e is combined with membrane voxel intensity information to yield a distance-intensity distribution for each time point, from which the mean velocity can be calculated.