
FIGURE 2.
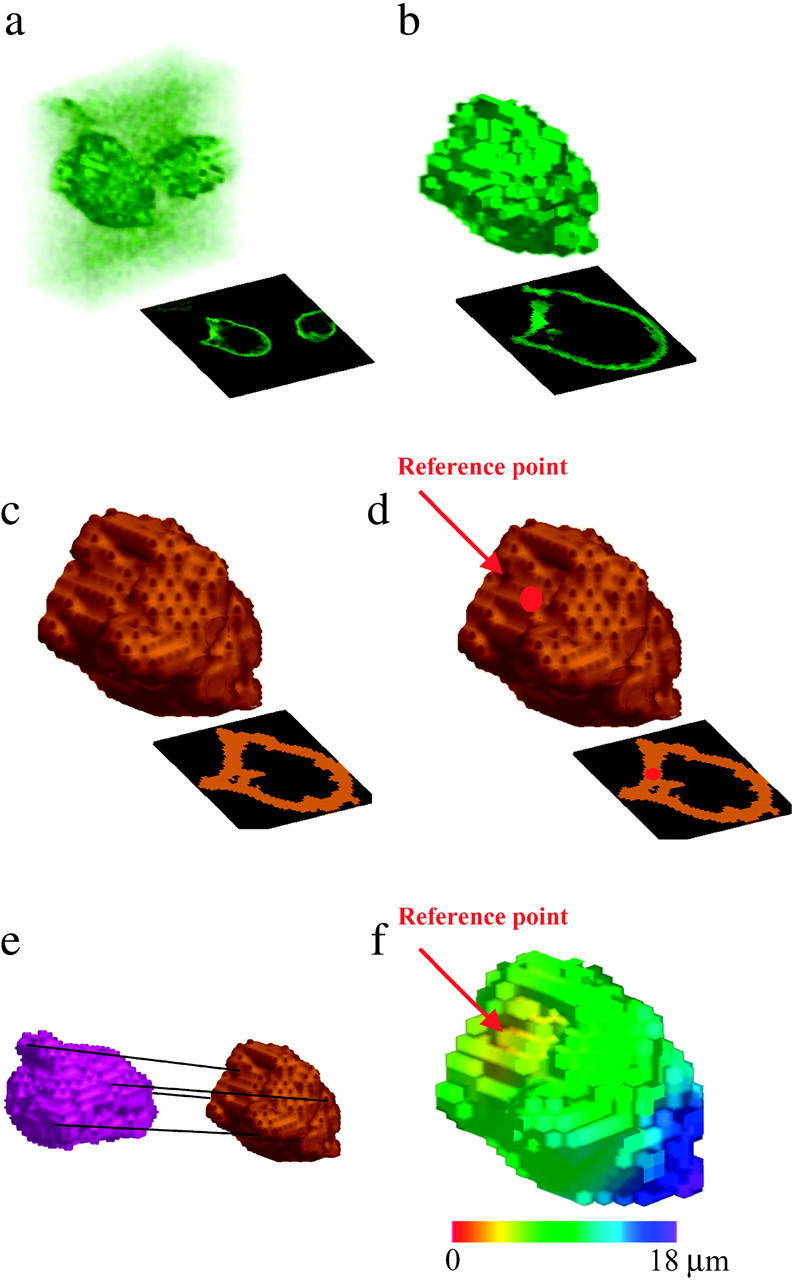
Images from the analysis of a single T-cell volume and renderings shown are from progressive analytic stages of a single time point from a CD3ζ-GFP data set. Each rendering shows the input data to the correspondingly lettered process in Fig. 1. Shown in panel a is the deconvolved microscopy data set. The set of membrane voxels identified by the segmentation filter is shown in panel b, and the reconstructed cell surface is shown in panel c. Shown in panel d is the cell surface with the reference point identified at 90 s after calcium flux, and shown in panel e are two aligned surfaces from the same cell at different time points. Shown in panel f is a distance map of the cell surface. Figure insets show x-y midsections through the cell.