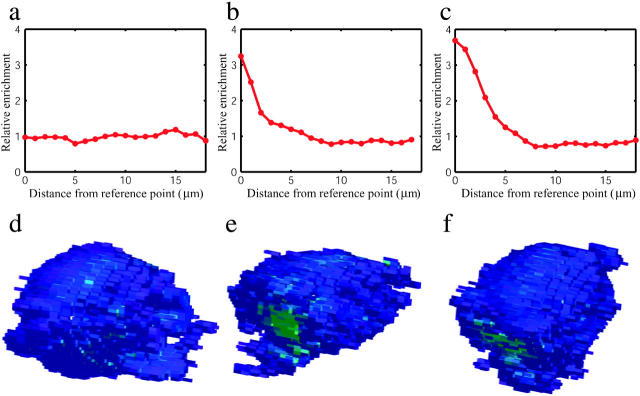
FIGURE 3.
Radial distribution of intensity. Plotted are distributions showing the relative enrichment of CD3ζ-GFP at each surface distance increment from the reference point. The distribution plotted in panel a is at 1 min before Ca2+ flux, the distribution in panel b is at 0.5 min after Ca2+ flux, and the distribution in panel c is 1.5 min after Ca2+ flux. Mean intensity-distance values are 9.8, 8.4, and 8.1 μm, respectively. Distributions are corrected for the total surface area present at each distance from the reference point (calculated as the fraction of total CD3ζ-GFP present at each distance divided by the fraction of surface area at that distance). The intensity profile shifts from a close approximation of a uniform distribution to one that is substantially skewed toward the reference point, consistent with clustering behavior. Renderings of the cell membrane points selected by our segmentation filter are shown in panels d, e, and f for time points corresponding to the distributions plotted, colored by voxel intensity.

