FIGURE 5.

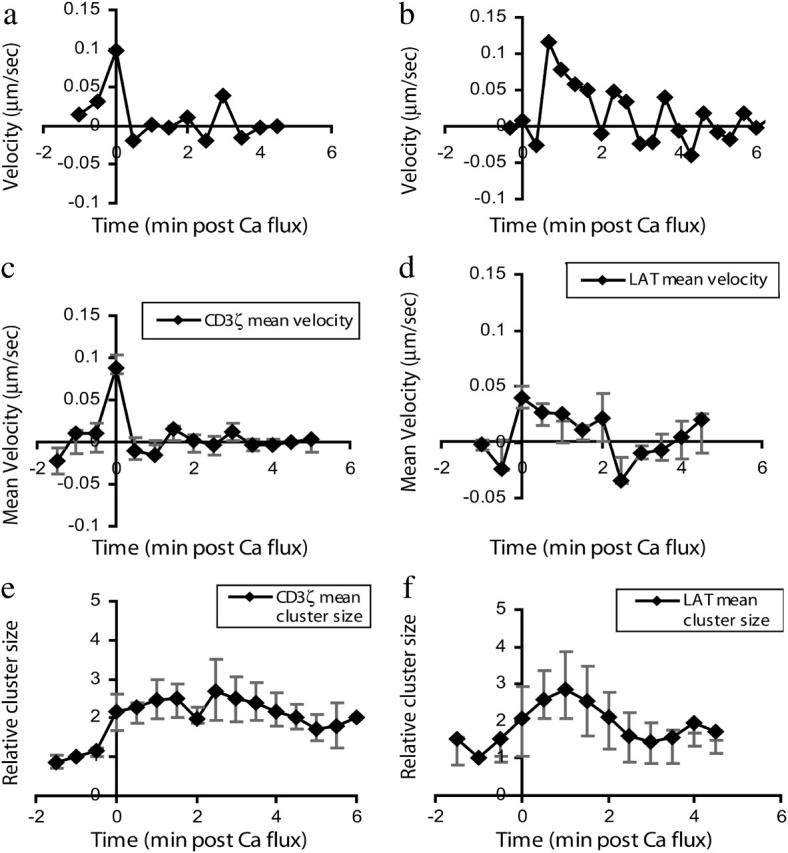
Receptor velocity in response to T-lymphocyte stimulation. (a) CD3ζ velocity measurements derived from bulk fluorescence measurements via our analytic system are plotted for a single cell. (b) A T-cell receptor velocity trace from the average of eight single-particle measurements is plotted using published data (Moss et al., 2002). (c) Shown are CD3ζ mean velocity measurements calculated based on analysis of six cells. (d) Plotted are mean velocity measurements for LAT movement toward the cell-cell interface. Values represent the mean of six cells. (e) Plotted are measurements of local CD3ζ cluster size near the interface. Values represent the mean of six cells. (f) Plotted are measurements of LAT local cluster size near the interface. Values plotted represent the mean of six cells. Both mean velocity and cluster size measurements show rapid LAT cluster formation followed by dissipation over the next 2 min, in contrast to the more stable cluster formation by CD3ζ. As our data are not normally distributed, nonparametric error analysis is used and error bars depict the first and third quartiles of the data in each plot.
