FIGURE 6.
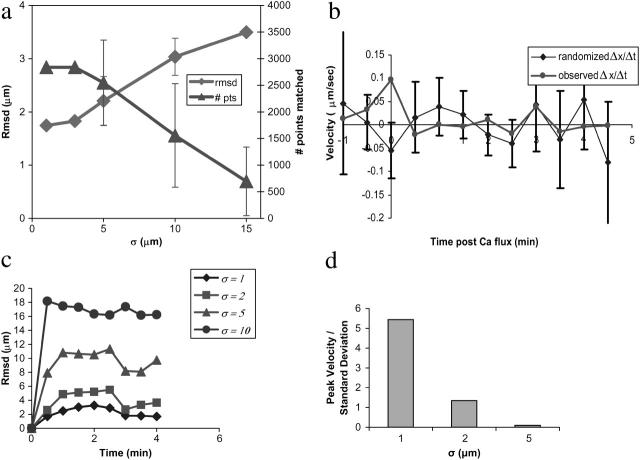
Robustness testing. Robustness of surface reconstruction to missing data is shown in panel a. Missing data were generated by randomly selecting a membrane surface voxel and deleting all voxels within a given radius. Surface reconstruction was performed on the data sets thus generated, and the resulting surface voxels were compared to the unperturbed surface via a closest point matching strategy. The number of matched points (# pts) and the root-mean-squared deviation (rmsd) of matched points are plotted as a function of increasing deletion radius. Surface reconstruction is robust to deletions of as large as 5 μm; larger deletions are unrealistic, as the mean radius of a T lymphocyte is 7 μm. To test the potential biasing effect of cluster analysis for reference point determination, we compare in panel b experimentally observed clustering velocities to those calculated on data sets with randomly permuted intensities. Initial peak receptor velocities for the observed experimental data significantly exceed those in the randomized data (p < 0.01). Error bars represent one standard deviation of the mean. Robustness of cell surface alignment to stepwise perturbation error is plotted in panel c. Root-mean-squared deviation (rmsd) from the unperturbed alignment is plotted as a function of time based on 20 perturbation experiments. Our method is robust to stepwise error of σ ≤ 2 μm. Robustness of cell surface alignment and subsequent velocity measurements to choice of reference point is shown in panel d. The ratio of clustering velocity to standard deviation for each error level is plotted for different error levels σ based on 24 perturbation experiments each.

