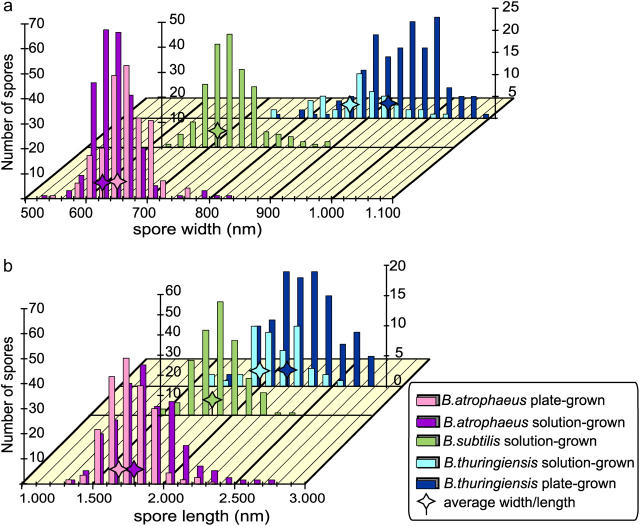
FIGURE 3.
Distribution of spore width (a) and length (b) for plate-grown (pg) and solution-grown (sg) B. atrophaeus and B. thuringiensis spores, and solution-grown B. subtilis spores. Average width and length are indicated with stars. Statistics for these distributions are given in Table 1.

