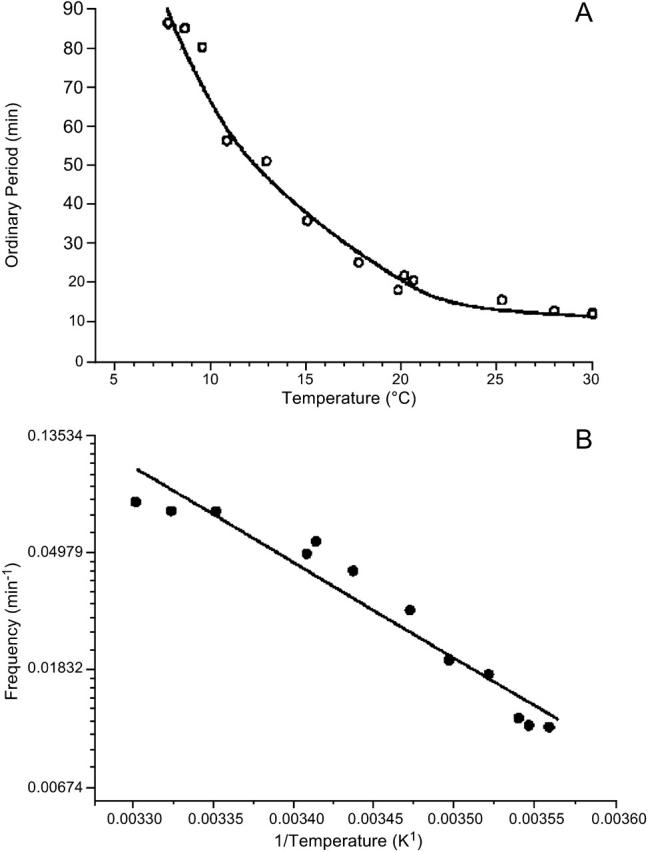
FIGURE 2.

Temperature dependence of the period of the glycolytic oscillations of the cell-free cytoplasmic extracts of yeast S. cerevisiae. The oscillation was induced by addition of trehalose and potassium phosphate and monitored by absorption at λ = 340 nm. (A) Plot of the period versus temperature. (B) Arrhenius plot of the data shown in panel A.
