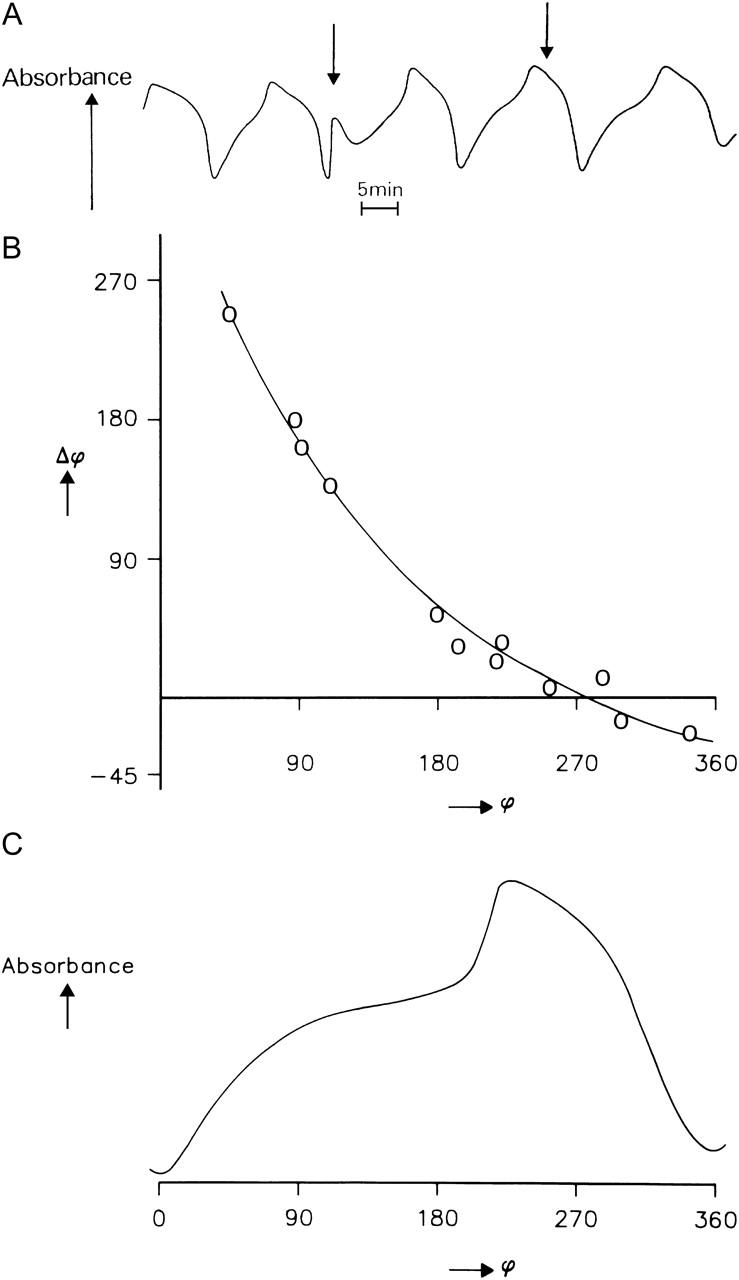
FIGURE 4.

Phase response curve derived by application of temperature pulses at a ground temperature of 20°C. (A) Typical example of the effect of a temperature pulse (ΔT = 20°C) on the oscillation. The arrows show the time when the temperature pulse was applied. The ground temperature was 20°C. (B) Phase advance (+Δϕ) and phase delay (−Δϕ) at different phases (ϕ) of the glycolytic oscillations. (C) Attribution of the different phases ϕ to a glycolytic cycle.
