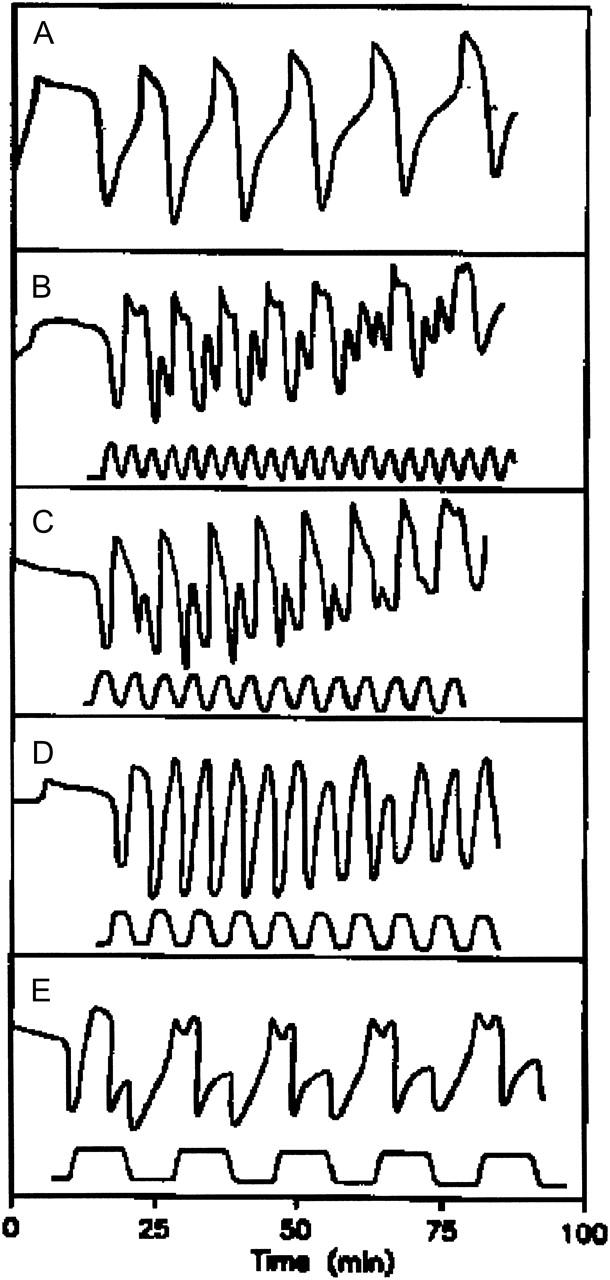
FIGURE 5.

The entrainment pattern of the glycolytic oscillations under periodic temperature variation. The unperturbed, autonomous oscillations, as measured by the NADH absorbance, are shown in panel A. In panels B–E the top trace corresponds to the NADH oscillation and the bottom trace to the temperature cycle. The amplitude of the temperature cycle is 7.5 ± 0.5°C.
