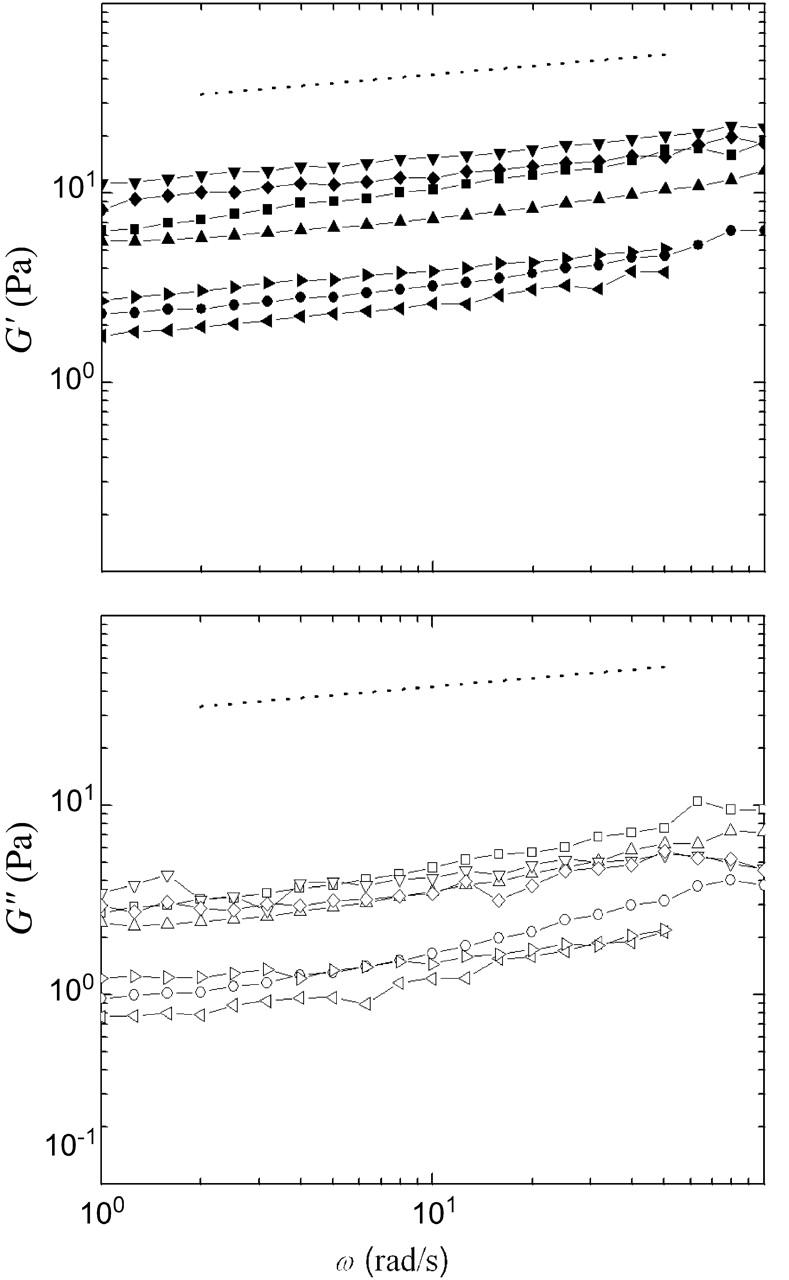
FIGURE 2.

Frequency-dependence of the viscoelastic response of untreated cytoplasmic extracts, with γo = 0.05. Each curve represents an independent measurement, showing the variation in the response. In all cases, the elastic modulus dominates the loss modulus, and both G′ (top, solid symbols) and G″ (bottom, open symbols) show a weak dependence on frequency. The dotted line has a slope of 0.15, indicating that at these frequencies the extract responds as a viscoelastic solid.
