
FIGURE 1.
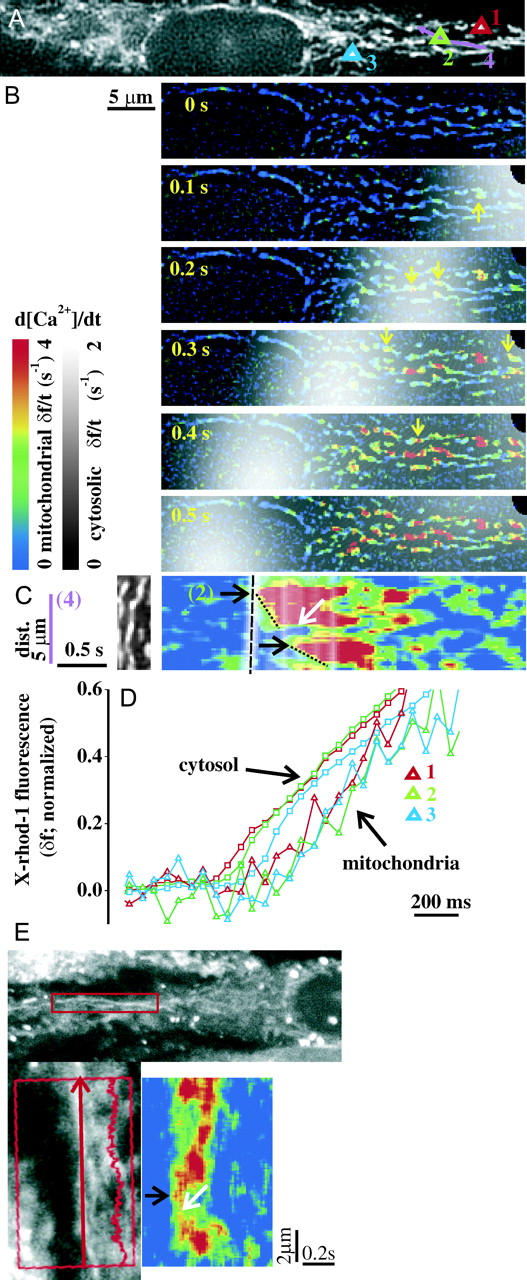
The initial phase of cytosolic and mitochondrial [Ca2+] rise in ATP-stimulated, intact RBCE cells. (A) Image of X-rhod-1 fluorescence at 3 s after application of ATP (100 μM). Regions 1–3 designate individual mitochondrial spots (corresponding traces are shown in D). Region 4 is a line over a single mitochondrion (see in C). (B) Overlay of d[Ca2+]c/dt in grayscale and d[Ca2+]m/dt in pseudocolor (shown as δf/t). The propagating white cloud indicates the front of the cytosolic Ca2+ wave. The rise of [Ca2+]m starts behind the cytosolic wavefront as hotspots in the mitochondrial network (arrows). (The full-length image series showing raw data and steps of image processing is available as Supplementary movie 1.) (C, Left) Fluorescence image of a selected mitochondrion (corresponding to region 4 in A; rotated). (C, Right) Time-space representation of d[Ca2+]c/dt and d[Ca2+]m/dt over region 4 which corresponds to the ordinate (dist. axis, μm). Black arrows indicate Ca2+ hotspots (the upper one is covered by region 2). The sloped profile of the onset of high d[Ca2+]m/dt (dotted lines) originating from the hotspots indicates the spreading of the [Ca2+]m rise. The dashed line indicates the cytosolic wavefront. The white arrow points to a barrier in the spreading of [Ca2+]m. (D) Plot of cytosolic (□) and mitochondrial (▵) δf (normalized to peak amplitude) over regions 1–3 (as indicated in A), calculated from the image series without smoothing and temporal differentiation. (E) (Top) Typical laser scanning confocal image of a resting, X-rhod-1-loaded RBCE cell. The rectangle indicates the mitochondrion selected for the line-scan acquisition, and this is also shown zoomed, rotated at the left. (Left) The arrow signifies the exact place of the line scan. (Right) Confocal line scan. Black arrow indicates a Ca2+ hotspot, and the white arrow a barrier (similarly as in C).