
FIGURE 7.
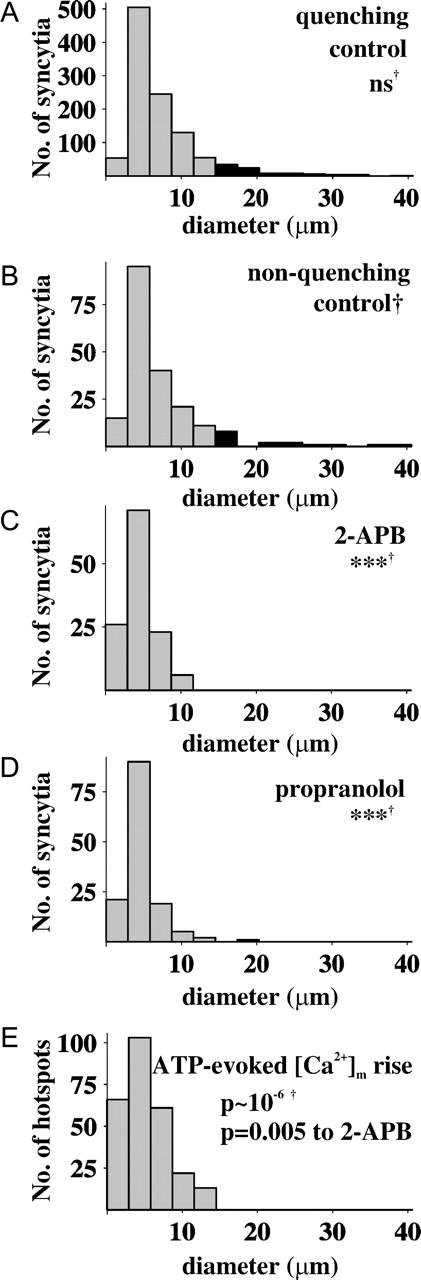
Histogram analysis of syncytium diameters and its comparison to the distance available for diffusion of [Ca2+]m. (A) Histogram of syncytium diameters estimated using quenching TMRM loading conditions (n = 1086 syncytia; ns, not significantly different from B compared by χ2-test; data corresponds to Fig. 5, C and D). (B) Histogram of syncytium diameters measured using nonquenching TMRM loading conditions (n = 198; Fig. 6 A); (C) effect of 2-APB (50 μM; nonquenching; ***, significance at p < 0.001 compared to B by χ2-test; n = 126; Fig. 6 C); (D) effect of propranolol (50 μM; nonquenching; n = 138; Fig. 6 D). (E) Histogram of distances available for intramitochondrial Ca2+ diffusion during ATP-stimulation of intact cells (or distance between barriers; n = 265 hotspots; Fig. 3).