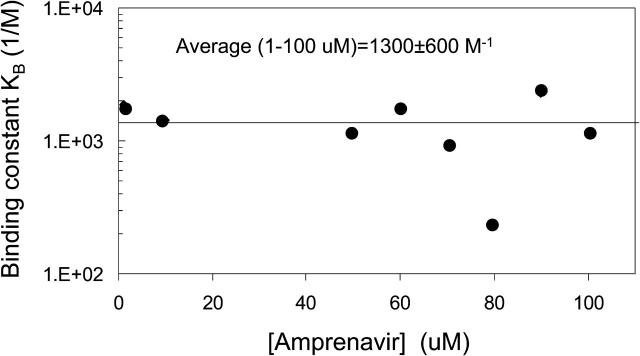
FIGURE 10.
Best-fit values for KB as a function of amprenavir concentration. The error bars are the standard deviation over the calculated KB for the best 300 fits, i.e., each concentration has a very tight fit for its predicted KB. The overall average for all amprenavir concentrations was KB = 1300 ± 600 M−1.

