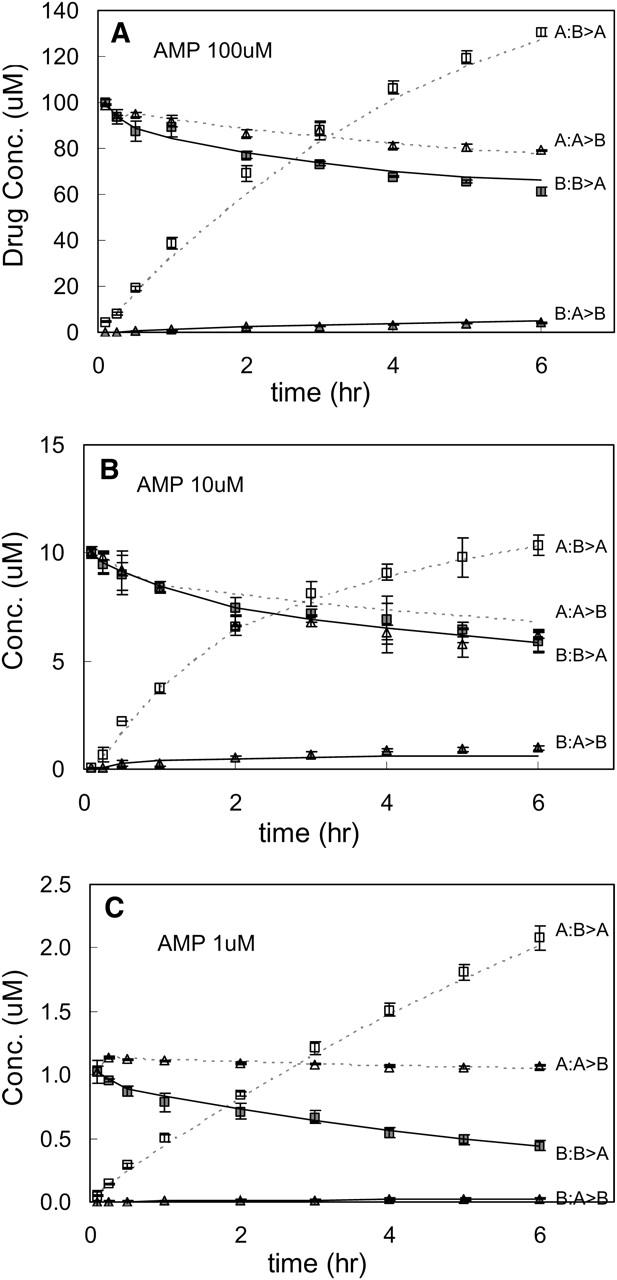
FIGURE 11.

Amprenavir data and the fits data and the fits (using the single-parameter vector in Table 4) are shown. Panel A shows the fit for all four data sets from 100 μM amprenavir. The B:B > A curve denotes the concentration of drug in the basolateral chamber when the donor chamber was the basolateral chamber, i.e., transport runs B > A. A:B > A would be the concentration in the apical chamber when the basolateral chamber is the donor. All B > A data are shown by squares: solid when the basolateral chamber was sampled, i.e., B:B > A, and open when the apical chamber was sampled, i.e., A:B > A. All A > B data are shown by triangles: solid when the basolateral chamber was sampled, i.e., B/A > B, and open when the apical chamber was sampled, i.e., A:A > B. The fits for the basolateral data are shown by the solid line, i.e., both B:B > A and B:A > B. The fits when the apical chamber is sampled are shown by the dotted line, i.e., both A:B > A and A:A > B. This format is also used for Figs. 12 and 13. Data shown were the average of triplicates, with standard deviation error bars. Panel B shows the data and fits for 10 μM amprenavir. Panel C shows the data and fits for 1 μM amprenavir. Note that 10 and 1 μM data sets were not used for fitting parameters. Similar quality fits for 90, 80, 70, 60, and 50 uM amprenavir are not shown.
