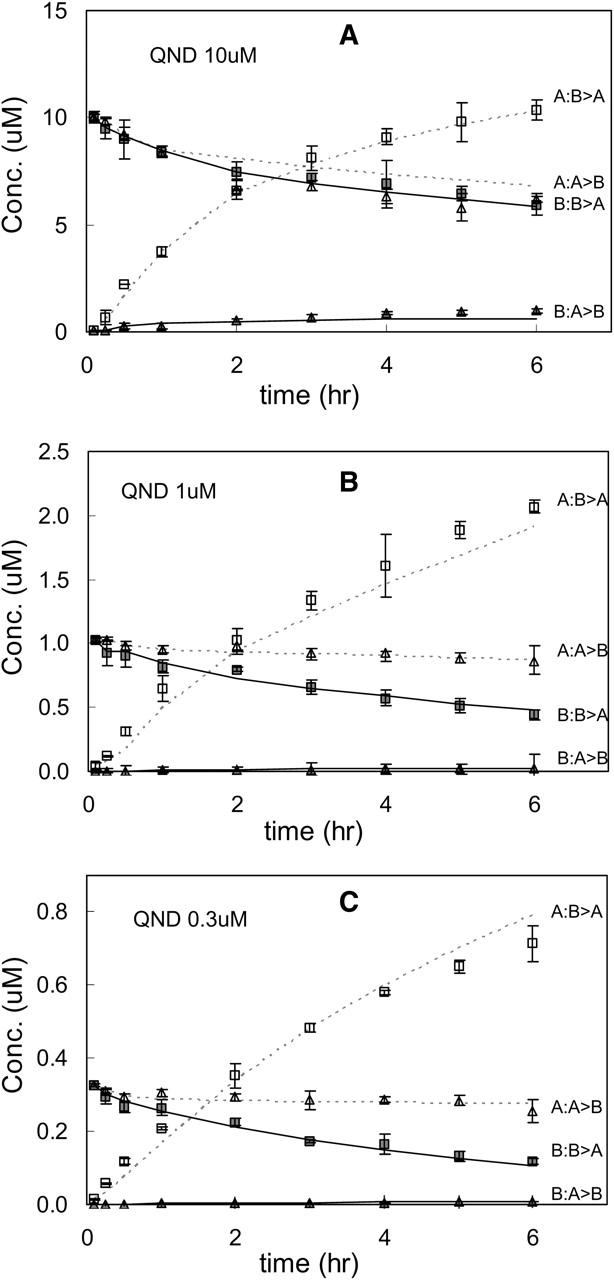
FIGURE 12.

Quinidine data and the fits (using the single-parameter vector in Table 4) are shown with the same format as Fig. 11. Panel A shows the fits for 10 μM quinidine, panel B for 1 μM quinidine, and panel C for 0.3 μM quinidine. Other quinidine concentrations—1, 2, 5, and 20 μM—showed essentially the same quality fits (data not shown).
