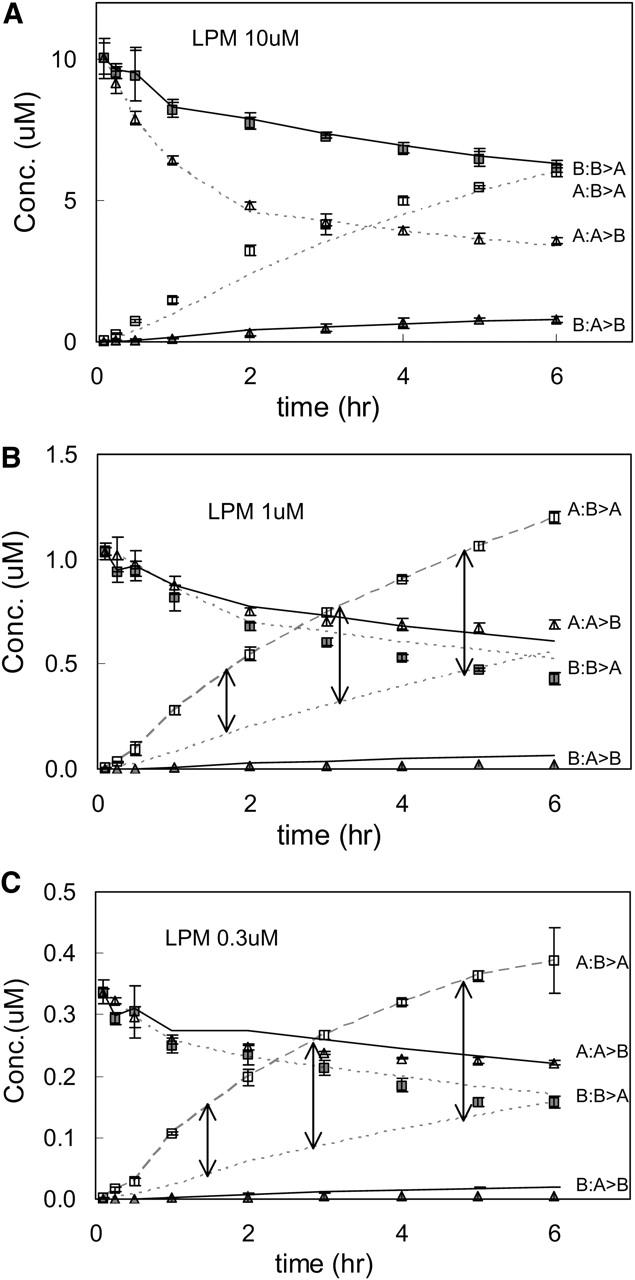
FIGURE 13.

Loperamide data and the fits (using the single-parameter vector in Table 4) are shown with the same format as Fig. 11. Panel A shows the fits for 10 μM loperamide, panel B for 1 μM loperamide, and panel C for 0.3 μM loperamide. In panels B and C, the A/B > A data are connected by a dashed line to guide the eye, and the fit is shown by the lower dotted lines. The vertical arrows connect these two curves to show the extent of the model's underestimate of these data. See text for a discussion of possible explanations; 3 and 20 μM loperamide showed essentially the same quality fits as 10 μM (data not shown).
