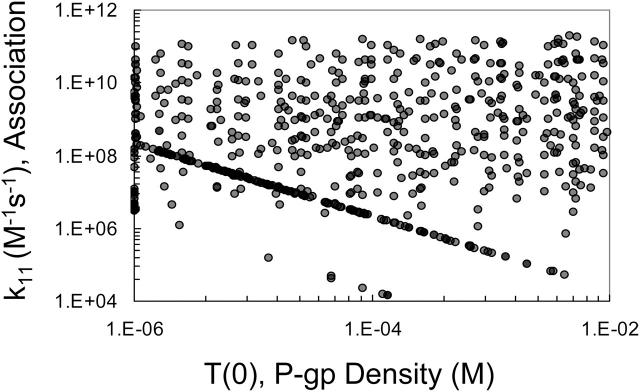
FIGURE 5.
Fitted pairs of the association rate constant, k11, and P-gp density, T(0), for 90 μM amprenavir remaining after the cut in Fig. 4 are graphed here. The range of the parameters has not been reduced in the fitting and they are uncorrelated, except for a small trend line at the bottom, which is examined in Fig. 8.

