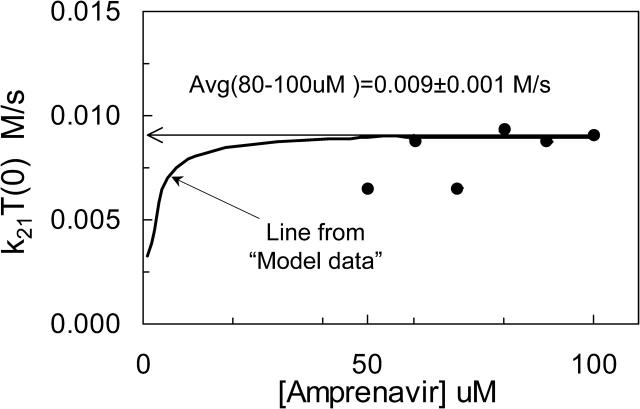
FIGURE 7.
Fitted values of k21T(0) for 50–100 μM amprenavir, (•), and predicted from simulated “model data” (solid line). Model data were simulated for the Michaelis-Menten reaction model for P-gp, without experimental error, using the parameters given in Table 4 for amprenavir. At each concentration, a predicted k21T(0) is found, just like in Fig. 6. The solid hyperbolic line is the predicted k21T(0) for all the model data. At high substrate concentrations, the k21T(0) used to simulate the model data was recovered. However, at low concentrations, the predicted k21T(0) was smaller than the correct value. The k21T(0) values predicted for each concentration of the amprenavir data are shown by solid circles. For each concentration, the best 300 fits gave the same value for k21T(0), i.e., the standard deviation for each point is much smaller than the size of the symbols. The average of the higher amprenavir concentrations was roughly k21T(0) = 0.009 M/s, which is the value shown in Tables 2 and 4 as k21T(0) = 180 (1/s) × 50 (μM) = 0.009 M/s. Thus, for all subsequent fittings for amprenavir, for each value of T(0) tested, we fixed the value of k21= (0.009 M/s)/T(0).

