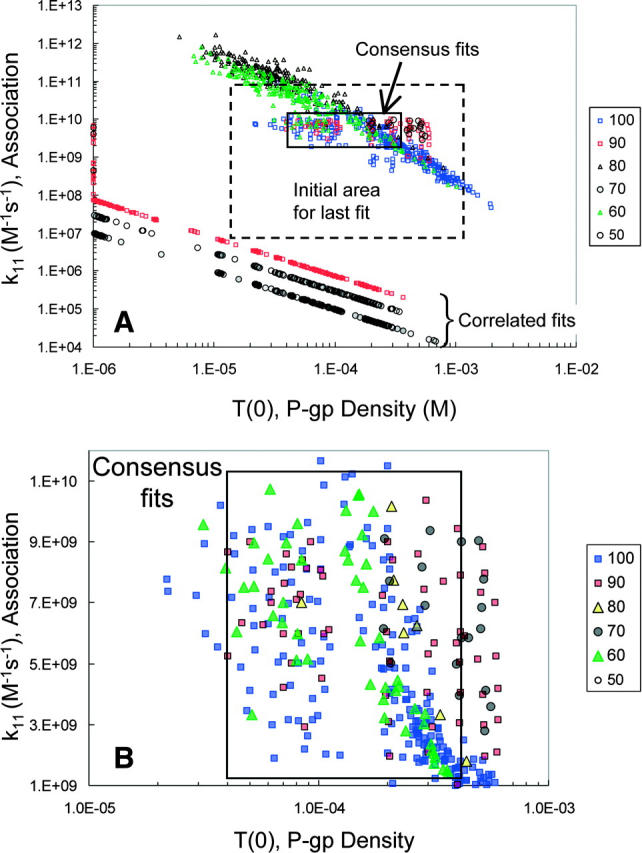
FIGURE 8.

Final forward fits for the amprenavir data. Panel A shows all pairs of T(0) and k11 that best fit the final fitting of the forward B > A amprenavir data, Run III. The initial grid for T(0) and k11 is the box with a dashed line border. The amprenavir concentrations are color coded, as shown by the legend. The box labeled “consensus fits” contains pairs from all amprenavir concentrations, except 50 μM, which had only correlated fits. Thus, any pair within the box gives essentially the same best fit to all amprenavir concentrations. There is also a series of fits labeled “correlated fits”, the straight lines at the bottom. These fits are different for each amprenavir concentration and show no reduction in volume. As explained in the text, these fits are artifacts from applying the fitting algorithm to the mass action kinetics of the Michaelis-Menten reaction. These fits may be discarded. Panel B is a blowup of the consensus fits, showing the distribution of fitted pairs. We shall see in Fig. 11 below that using parameter values in the center of this box gives good fits to all amprenavir concentrations, despite the fact that 1, 10, and 50 μM amprenavir yielded only correlated fits (data not shown).
