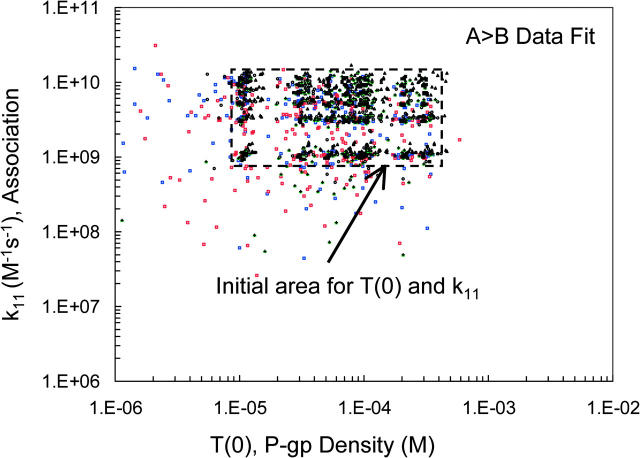
FIGURE 9.
Final reverse fits, A > B, for the amprenavir data, Run V. The 300 best-fitting pairs of T(0) and k11 are shown. The initial grid for T(0) and k11 is shown as a box with a dashed line border. The amprenavir concentrations are color coded as in Fig. 8. The initial pairs of (T(0), k11) were uniformly distributed within the dashed line box, showing that fits for these forward parameters to the A > B data did not change significantly, and no correlated fits were found. This proves that our separation of the forward and reverse fits did not affect the final fitted ranges for the forward parameters.

