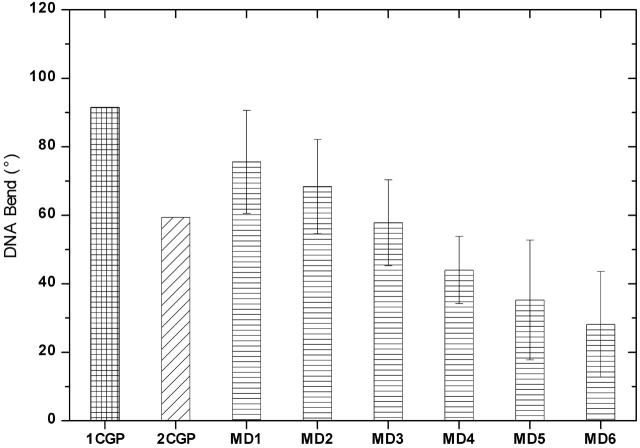
FIGURE 1 .
MD1 and MD2 present the average curvature after 5 ns simulation of the CAP DNA complex with minimal and excess salt, respectively. The error bars represent the statistical uncertainty of one standard deviation in the calculated curvature. MD3 denotes the average curvature in simulation with intact DNA, and MD4 is the average observed in the simulation of 2CGP structure. MD5 and MD6 are the curvature of free DNA in simulations starting from the protein-bound and canonical B-form, respectively.

