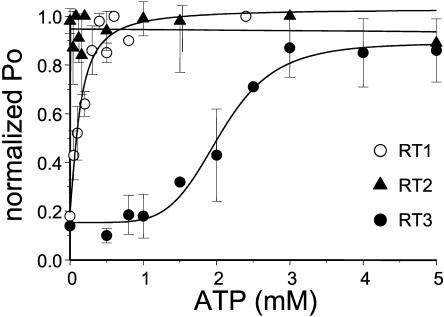
FIGURE 8.
ATP modulation of mammalian InsP3R isoforms. The single-channel open probability (Po) for each InsP3R isoform was measured as a function of Na2ATP concentrations on the cis (cytoplasmic) side of the membrane at pCa 6.7 in the presence of 2 μM InsP3. The normalized and averaged data (see Materials and Methods) are shown as means ± SE (n ≥ 3) for RT1 (○), RT2 (▴), and RT3 (•). The data for RT1 and RT3 were fit by Eq. 2 (see Materials and Methods). The parameters of the best fit (curves) are in Table 2. The data for RT2 were fit by a linear regression (line).

