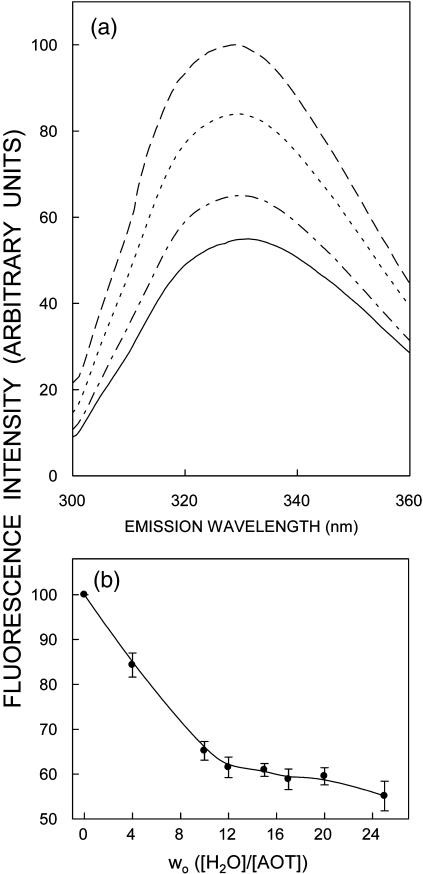
FIGURE 2.
Effect of increasing amounts of added water on (a) fluorescence emission spectra and (b) fluorescence intensity of gramicidin in AOT reverse micelles. Fluorescence emission spectra are shown in a as a function of [water]/[surfactant] molar ratio (wo) in order of decreasing intensity corresponding to wo = 0 (dashed line), 4 (dotted line), 10 (dash-dotted line), and 25 (solid line). Fluorescence intensity was monitored at 328 nm and is plotted as a function of wo in b. The data points shown are the mean ± standard error of five independent measurements. The excitation wavelength used was 280 nm. The ratio of gramicidin to surfactant (AOT) was 1:6250 (mol/mol) and the concentration of gramicidin was 8 μM in all cases. See Materials and Methods for other details.

