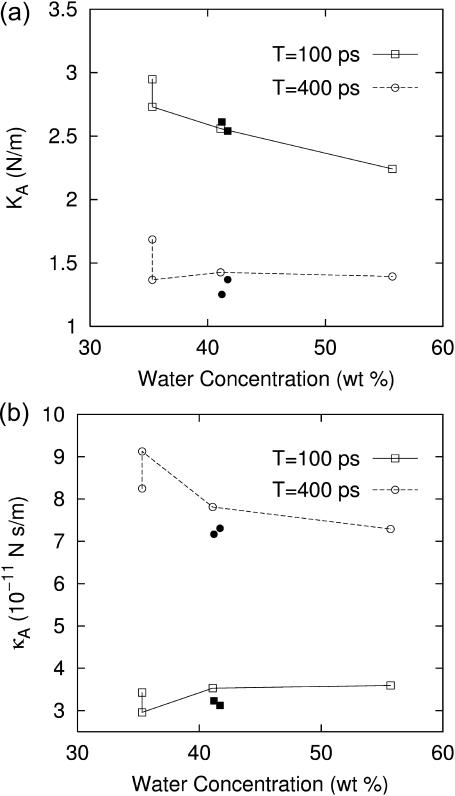
FIGURE 9.
Plots of (a) the area compressibility modulus KA and (b) the surface viscosity for area change κA as a function of water concentration of the system. Results with two different periods, T = 100 ps (solid line) and 400 ps (dashed line), are shown. The four connected open symbols correspond to the DMPC systems D1–D4, from left to right. The solid symbols of the same shape represent the gA systems g1 and g2. The data were obtained from Table 4 using Eq. 11.

