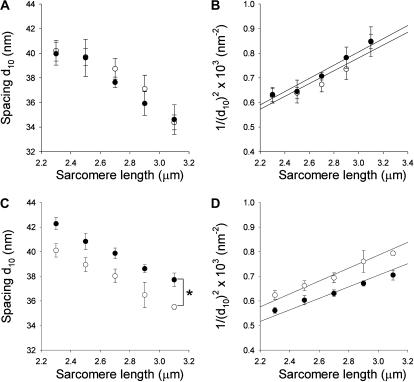
FIGURE 3.
Filament 1.0 equatorial spacing determined in x-ray diffraction measurements on psoas (A and B) and soleus (C and D) fiber bundles from Des+/+ (open symbols) and Des−/− (solid symbols) mice. In A and C, the 1.0 spacing (d10) is plotted against sarcomere length and in B and D, 1/(d10)2 is plotted against sarcomere length. Linear regressions were used to calculate apparent lattice volumes (Millman, 1998): Des+/+ psoas, 3.2 × 10⁻³ μm3; Des−/− psoas, 3.1 × 10⁻³ μm3; Des+/+ soleus, 3.2 × 10⁻³ μm3; Des−/− soleus, 3.6 × 10⁻³ μm3 per sarcomere. The spacing of the relaxed Des−/− soleus muscle (solid circles in C) was significantly larger compared to the Des+/+ group (ANOVA, p < 0.05).

