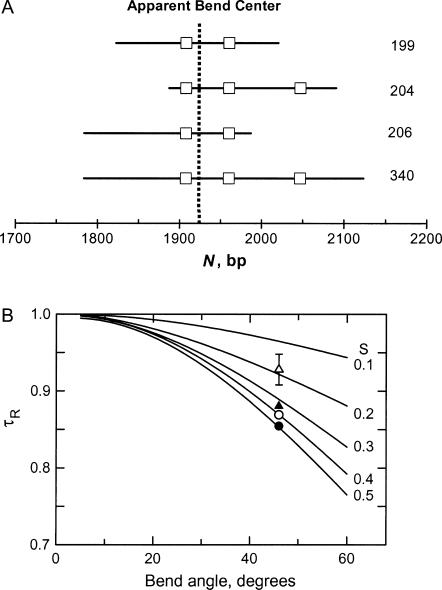
FIGURE 4.
(A) Schematic diagram of the relationship between the four overlapping restriction fragments used to analyze the curvature of the 199-bp fragment. For ease of reference, the square boxes indicate the positions of A- or T-tracts containing five or more residues; the vertical dashed line corresponds to the location of the apparent bend center at 1922 bp. The size of each restriction fragment is indicated at the right. (B) Comparison of average τ-ratios measured in buffers B and C at 20°C with theoretical curves calculated as a function of the apparent bend angle and relative position, S, with respect to the end of the fragment. From top to bottom, the symbols correspond to fragments containing: (▵) 204 bp; (▴) 206 bp; (○) 340 bp; and (•) 199 bp. The error bar bracketing the symbol for the 204-bp fragment corresponds to the average standard deviation of the τ-ratios measured for the various fragments in buffers B and C. The values of S obtained for the 204-, 206-, 340-, and 199-bp fragments are 0.18, 0.33, 0.41, and 0.50, respectively.

