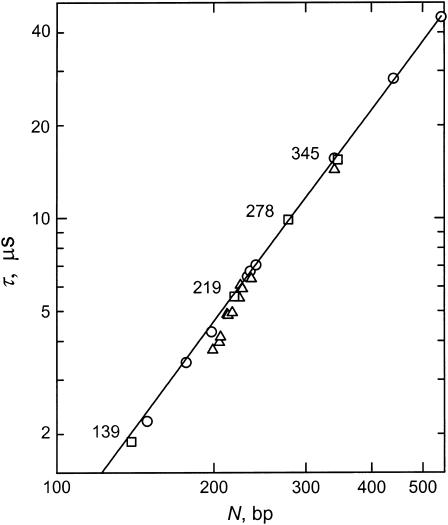
FIGURE 7.
Log-log plot of the dependence of the terminal relaxation times, τ, on DNA molecular weight, N, in bp, in buffer B at 20°C. (○) Normal control fragments; (▵) the parent 199-bp fragment, sequence mutants, and insertion derivatives; and (□) restriction fragments that do not contain the curvature module, have the apparent bend center located very close to one end, or have had the curvature module replaced by an equal-sized insert of normal DNA from pUC19. The solid line corresponds to the fitting function describing the τ-values of the normal control fragments.

