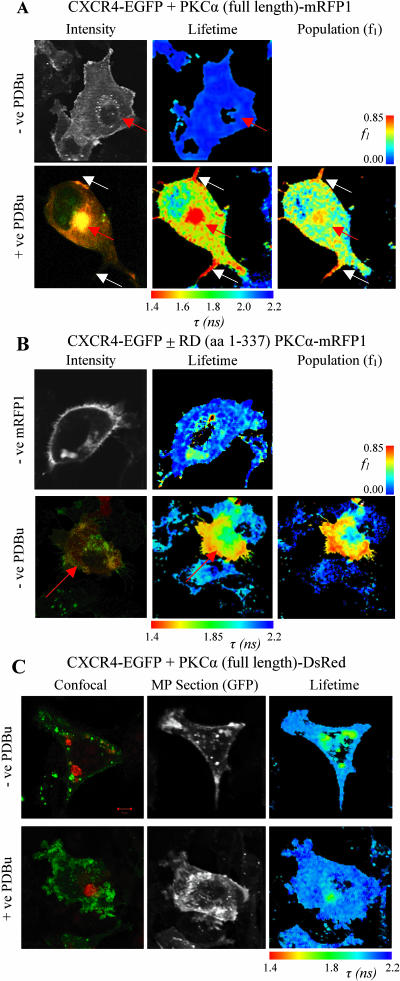
FIGURE 5.
(A) Images of cells co-expressing CXCR4-EGFP and full-length PKCα-mRFP1 with or without phorbol ester treatment. The microinjected PKCα-positive red fluorescent cells are indicated in each panel (red arrows). Increased FRET populations were observed in the vesicular compartment and filopodial cell protrusions (white arrows). The intensity image for the +ve PDBu panel is taken from confocal data and shows regions of co-localization between CXCR4-EGFP (red) and PKCα-mRFP1 (green). (B) Images of cells expressing CXCR4-EGFP with regulatory domain (RD) PKCα-mRFP1 spanning amino acid residues 1–337 (RD (aa 1–337) PKCα-mRFP1) and the associated RD (aa 1–337) PKCα-mRFP1 negative control. The +ve RD (aa 1–337) PKCα-mRFP1 intensity image is taken from confocal data and shows colocalization of CXCR4-EGFP (green) and RD (aa 1–337) PKCα-mRFP1 (red). Donor lifetime images and the corresponding FRET population cell map in the presence of RD (aa 1–337) PKCα-mRFP1, where fitting with a bi-exponential decay model is possible are shown. The field of view was chosen such that the lifetime map of the microinjected +ve RD (aa 1–337) PKCα-mRFP1 cell could be compared to an adjacent −ve RD (aa 1–337) PKCα-mRFP1 cell. (C) Images of cells co-expressing CXCR4-EGFP and full-length PKCα-DsRed with or without phorbol ester treatment. Confocal images show PKCα-DsRed (red) aggregates that do not colocalize with CXCR4-EGFP (green) but indicate a short lifetime component that contaminates each lifetime map. No increase in association/FRET is observed in the presence of PDBu.

