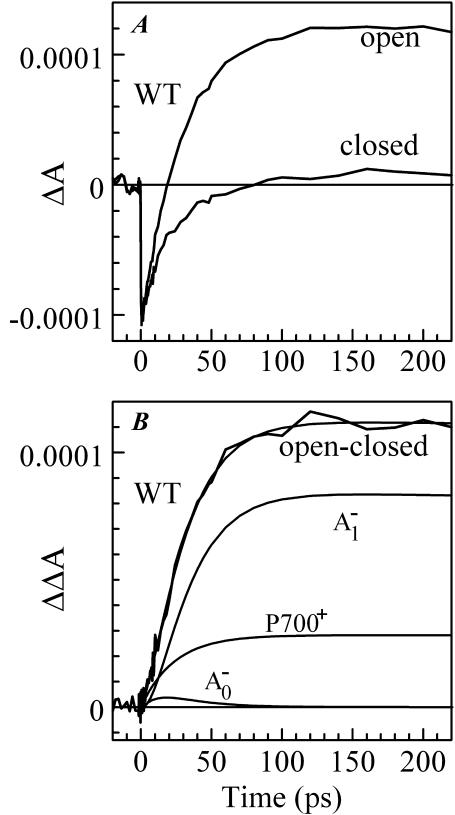
FIGURE 2.
Time-resolved absorption difference profiles for WT PS I complex excited at 660 nm and probed at 390 nm. Negative-going signals indicate photobleaching/stimulated emission. (A) Time-resolved absorption difference profiles obtained for PS I complexes with open and closed RC. (B) Time-resolved (open-closed) absorption difference profile, optimized fit to it using Eq. 1, and signal contributions due to the formation of  and
and 

