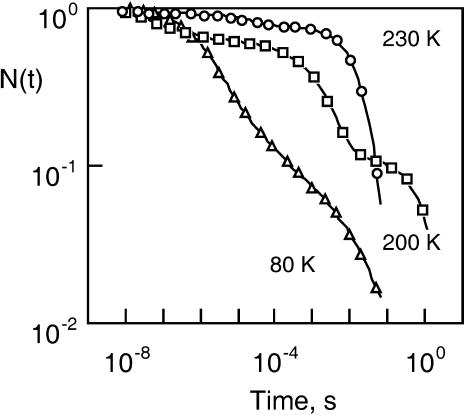
FIGURE 1.
Example of the kinetic heterogeneity and of the so-called inverse temperature dependence as observed in ligand rebinding with many hemoproteins. The data refer to CO rebinding with cytochrome P450cam and camphane as a substrate. N(t) is the normalized survival fraction of un-rebound CO. The solvent was glycerol/water (64% w/w). For clarity, only a few points per time decade are shown. The lines are the fits obtained by using the maximum entropy method. The corresponding rate spectra are given in Fig. 11.

